

1
UNITED STATES
SECURITIES AND EXCHANGE COMMISSION
Washington, D.C. 20549
FORM
For the quarterly period ended
OR
For the transition period from to
Commission File Number:
(Exact name of registrant as specified in its charter)
(State or other jurisdiction of incorporation) | (IRS Employer Identification Number) | |
| ||
(Address of principal executive offices) (Zip Code) | ||
( | ||
(Registrant’s telephone number, including area code) N/A (Former Name, Former Address and Former Fiscal Year, | ||
Securities registered pursuant to Section 12(b) of the Act:
Title of each class |
| Trading Symbol(s) |
| Name of each exchange on which registered |
|
| The |
Indicate by check mark whether the registrant (1) has filed all reports required to be filed by Section 13 or 15(d) of the Securities Exchange Act of 1934 during the preceding 12 months (or for shorter period that the registrant was required to file such reports), and (2) has been subject to such filing requirements for the past 90 days. [X]
Indicate by check mark whether the registrant has submitted electronically every Interactive Data File required to be submitted pursuant to Rule 405 of Regulation S-T (§ 232.405 of this chapter) during the preceding 12 months (or for such shorter period that the registrant was required to submit such files). [X]
Indicate by check mark whether the registrant is a large accelerated filer, an accelerated filer, a non-accelerated filer, a smaller reporting company, or an emerging growth company. See the definitions of “large accelerated filer,” “accelerated filer,” “smaller reporting company,” and “emerging growth company” in Rule 12b-2 of the Exchange Act.
Large accelerated filer ☐ | Accelerated filer ☐ |
Smaller reporting company | |
Emerging growth company |
|
If an emerging growth company, indicate by check mark if the registrant has elected not to use the extended transition period for complying with any new or revised financial accounting standards provided pursuant to Section 13(a) of the Exchange Act.
Indicate by check mark whether the registrant is a shell company (as defined in Rule 12b-2 of the Exchange Act).
As of May 10, 2023, the registrant had
TABLE OF CONTENTS
2 | ||
2 | ||
Management’s Discussion and Analysis of Financial Condition and Results of Operations. | 29 | |
48 | ||
48 | ||
48 | ||
48 | ||
48 | ||
Unregistered Sales of Equity Securities and Use of Proceeds. | 49 | |
49 | ||
49 | ||
49 | ||
50 | ||
52 | ||
PART I — FINANCIAL INFORMATION
Item 1Financial Statements.
LOOP MEDIA, INC. AND SUBSIDIARIES
CONDENSED CONSOLIDATED BALANCE SHEETS
March 31, |
| September 30, | |||
2023 | 2022 | ||||
ASSETS | (UNAUDITED) |
|
| ||
Current assets |
|
|
| ||
Cash | $ | | $ | | |
Accounts receivable, net |
| |
| | |
Prepaid expenses and other current assets |
| |
| | |
Deferred offering costs | | — | |||
Content assets - current | | | |||
Total current assets |
| |
| | |
Non-current assets |
|
|
|
| |
Deposits |
| |
| | |
Content assets - non current | | | |||
Property and equipment, net |
| |
| | |
Operating lease right-of-use assets |
| |
| | |
Intangible assets, net |
| |
| | |
Total non-current assets |
| |
| | |
Total assets | $ | | $ | | |
LIABILITIES AND STOCKHOLDERS’ EQUITY |
|
|
| ||
Current liabilities |
|
|
|
| |
Accounts payable | $ | | $ | | |
Accrued liabilities | | | |||
Accrued royalties and revenue share | | | |||
Payable on acquisition |
| — |
| | |
License content liabilities - current | | | |||
Deferred Income |
| — |
| | |
Lease liability - current | | | |||
Non-revolving line of credit |
| |
| — | |
Total current liabilities |
| |
| | |
Non-current liabilities |
|
|
|
| |
Non-revolving line of credit | — | | |||
Non-revolving line of credit, related party | | | |||
Revolving line of credit | | | |||
Total non-current liabilities |
| |
| | |
Total liabilities |
| |
| | |
Commitments and contingencies (Note 9) | |||||
Stockholders’ equity | |||||
Common Stock, $ |
| |
| | |
Additional paid in capital |
| |
| | |
Accumulated deficit |
| ( |
| ( | |
Total stockholders' equity |
| ( |
| | |
Total liabilities and stockholders' equity | $ | | $ | | |
See the accompanying notes to the consolidated financial statements
2
LOOP MEDIA, INC. AND SUBSIDIARIES
CONDENSED CONSOLIDATED STATEMENTS OF OPERATIONS
(UNAUDITED)
Three months ended March 31, | Six months ended March 31, | ||||||||||
| 2023 | 2022 |
| 2023 | 2022 | ||||||
Revenue | $ | | $ | | $ | | $ | | |||
Cost of revenue | |||||||||||
Cost of revenue - Advertising and Legacy and other revenue | |
| | |
| | |||||
Cost of revenue - depreciation and amortization | | | | | |||||||
Total cost of revenue | | | | | |||||||
Gross profit | |
| | |
| | |||||
Operating expenses |
|
|
|
|
|
| |||||
Sales, general and administrative | | | | | |||||||
Stock-based compensation | | | | | |||||||
Depreciation and amortization | | | | | |||||||
Total operating expenses | |
| | |
| | |||||
Loss from operations | ( |
| ( | ( |
| ( | |||||
Other income (expense) |
|
|
|
|
|
| |||||
Interest income | — |
| — | — |
| | |||||
Interest expense | ( |
| ( | ( |
| ( | |||||
Gain (Loss) on extinguishment of debt, net | — |
| — | — |
| | |||||
Change in fair value of derivatives | — |
| | — |
| | |||||
Other income | ( | — | ( | — | |||||||
Total other income (expense) | ( |
| ( | ( |
| ( | |||||
Loss before income taxes | ( | ( | ( | ( | |||||||
Income tax (expense)/benefit | — |
| ( | ( |
| ( | |||||
Net loss | $ | ( | $ | ( | $ | ( | $ | ( | |||
|
| ||||||||||
Basic and diluted net loss per common share | ( | $ | ( | ( | $ | ( | |||||
Weighted average number of basic and diluted common shares outstanding | |
| | |
| | |||||
See the accompanying notes to the consolidated financial statements
3
LOOP MEDIA, INC. AND SUBSIDIARIES
CONDENSED CONSOLIDATED STATEMENT OF CHANGES IN STOCKHOLDERS’ EQUITY
FOR THE SIX MONTHS ENDED MARCH 31, 2023, and 2022
(UNAUDITED)
Preferred Stock Series B | Common Stock | Additional Paid | Accumulated | ||||||||||||||||
Shares | Amount | Shares | Amount | in Capital | Deficit | Total | |||||||||||||
Balances, September 30, 2022 |
| — |
| $ | — |
| |
| $ | |
| $ | |
| $ | ( |
| $ | |
Stock-based compensation | — | — | — | — | | — | | ||||||||||||
Net loss |
| — |
| — |
| — |
| — |
| — |
| ( |
| ( | |||||
Balances, December 31, 2022 |
| — | $ | — |
| | $ | | $ | | $ | ( | $ | | |||||
Stock-based compensation | — | — | — | — | | — | | ||||||||||||
Short swing profit recovery | — | — | — | — | | — | | ||||||||||||
Issuance costs from uplist of stock | — | — | — | — | ( | — | ( | ||||||||||||
Net loss |
| — |
| — |
| — |
| — |
| — |
| ( |
| ( | |||||
Balances, March 31, 2023 |
| — | $ | — |
| | $ | | $ | | $ | ( | $ | ( | |||||
Preferred Stock Series B | Common Stock | Additional Paid | Accumulated | ||||||||||||||||
Shares | Amount | Shares | Amount | in Capital | Deficit | Total | |||||||||||||
Balances, September 30, 2021 |
| |
| $ | |
| |
| $ | |
| $ | |
| $ | ( |
| $ | |
Stock-based compensation | — | — | — | — | | — | | ||||||||||||
Net loss |
| — |
| — |
| — |
| — |
| — |
| ( |
| ( | |||||
Balances, December 31, 2021 |
| | $ | |
| | $ | | $ | | $ | ( | $ | | |||||
Stock-based compensation | — | — | — | — | | — | | ||||||||||||
Warrants issued to consultants | — | — | — | — | | — | | ||||||||||||
Payment in kind interest stock issuance | — | — | | | | — | | ||||||||||||
Conversion of series B convertible stock to common stock | ( | ( | | | ( | — | — | ||||||||||||
Net loss |
| — |
| — |
| — |
| — |
| — |
| ( |
| ( | |||||
Balances, March 31, 2022 |
| — | $ | — |
| | $ | | $ | | $ | ( | $ | ( | |||||
See the accompanying notes to the consolidated financial statements
4
LOOP MEDIA, INC. AND SUBSIDIARIES
CONDENSED CONSOLIDATED STATEMENTS OF CASH FLOWS
(UNAUDITED)
Six months ended March 31, | |||||
2023 |
| 2022 | |||
CASH FLOWS FROM OPERATING ACTIVITIES |
|
|
| ||
Net loss | $ | ( | $ | ( | |
Adjustments to reconcile net loss to net cash used in operating activities: |
|
|
| ||
Amortization of debt discount |
| | | ||
Depreciation and amortization expense |
| | | ||
Amortization of content assets | | | |||
Amortization of right-of-use assets |
| | | ||
Bad debt expense | — | | |||
Gain on extinguishment of debt, net | — | ( | |||
Change in fair value of derivative | — | ( | |||
Stock-based compensation |
| | | ||
Payment in kind for interest stock issuance | — | | |||
Change in operating assets and liabilities: |
|
| |||
Accounts receivable |
| | ( | ||
Prepaid income tax | — | ( | |||
Inventory |
| | | ||
Prepaid expenses |
| | ( | ||
Deposit |
| ( | ( | ||
Accounts payable |
| ( | | ||
Accrued liabilities | ( | | |||
Accrued royalties and revenue share | ( | | |||
Licensed content liability |
| ( | ( | ||
Operating lease liabilities |
| ( | ( | ||
Deferred income |
| ( | ( | ||
NET CASH USED IN OPERATING ACTIVITIES |
| ( |
| ( | |
CASH FLOWS FROM INVESTING ACTIVITIES |
|
|
|
| |
Purchase of property and equipment |
| ( | — | ||
NET CASH USED IN INVESTING ACTIVITIES |
| ( |
| — | |
CASH FLOWS FROM FINANCING ACTIVITIES |
|
|
|
| |
Proceeds from issuance of common stock | — | | |||
Proceeds from credit facility | — | | |||
Proceeds from line of credit | | — | |||
Payments on line of credit | ( | — | |||
Debt issuance costs | ( | — | |||
Issuance costs for stock uplist | ( | — | |||
Deferred offering costs | ( | ( | |||
Payment of acquisition related consideration | ( | — | |||
Repayment of stockholder loans | — | ( | |||
Short swing profit recovery | | — | |||
NET CASH PROVIDED BY FINANCING ACTIVITIES |
| |
| | |
Change in cash and cash equivalents |
| ( |
| ( | |
Cash, beginning of period |
| |
| | |
Cash, end of period | $ | | $ | | |
SUPPLEMENTAL DISCLOSURES OF CASH FLOW STATEMENTS |
|
|
|
| |
Cash paid for interest | $ | | $ | | |
Cash paid for income taxes | $ | | $ | | |
SUPPLEMENTAL DISCLOSURES OF NON CASH INVESTING AND FINANCING ACTIVITIES |
|
|
|
| |
Payment in kind common stock payment | $ | — | $ | | |
Conversion of Preferred Class B stock to common stock | $ | — | $ | | |
Unpaid deferred offering costs | $ | | $ | | |
Unpaid additions to property and equipment | $ | | $ | — | |
Unpaid additions to licensed and internally developed content | $ | | $ | — | |
See the accompanying notes to the consolidated financial statements
5
LOOP MEDIA, INC. AND SUBSIDIARIES
NOTES TO CONDENSED CONSOLIDATED FINANCIAL STATEMENTS
MARCH 31, 2023
(UNAUDITED)
NOTE 1 – BUSINESS
Loop Media, Inc., a Nevada corporation, (collectively, “Loop Media,” the “Company,” “we,” “us” or “our”) is a multichannel digital video platform media company that uses marketing technology, or “MarTech,” to generate our revenue and offer our services. Our technology and vast library of videos and licensed content enable us to curate and distribute short-form videos to out-of-home (“OOH”) dining, hospitality, retail, convenience stores and other locations and venues to enable them to inform, entertain and engage their customers. Our technology provides third-party advertisers with a targeted marketing and promotional tool for their products and services and, in certain instances, allows us to measure the number of potential viewers of such advertising and promotional materials. We also allow our OOH clients to access our service without advertisements by paying a monthly subscription fee.
We offer hand-curated music video content licensed from major and independent record labels, including Universal Music Group (“Universal”), Sony Music Entertainment (“Sony”), and Warner Music Group (“Warner” and collectively with Universal and Sony, the “Music Labels”), as well as non-music video content, which is predominantly licensed or acquired from third parties, including action sports clips, drone and atmospheric footage, trivia, news headlines, lifestyle channels and kid-friendly videos, as well as movie, television and video game trailers, amongst other content. We distribute our content and advertising inventory to digital screens located in OOH locations primarily through (i) our owned and operated platform (the “O&O Platform”) of Loop Media-designed “small-box” streaming Android media players (“Loop Players”) and legacy ScreenPlay computers and (ii) through screens on digital platforms owned and operated by third parties (each a “Partner Platform” and collectively, the “Partner Platforms,” and together with the O&O Platform, the “Loop Platform”). As of March 31, 2023, we had
We define an “active unit” as (i) an ad-supported Loop Player (or DOOH location using our ad- supported service through our “Loop for Business” application or using an DOOH venue-owned computer screening our content) that is online, used on our O&O Platform, playing content, and has checked into the Loop analytics system at least once in the 90-day period or (ii) a DOOH location customer using our subscription service on our O&O Platform at any time during the 90-day period. We use “QAU” to refer to the number of such active units during such period. We do not count towards our QAUs any Loop Players or screens used on our Partner Platform.
Liquidity and management’s plan
As shown in the accompanying consolidated financial statements, we have incurred significant recurring losses resulting in an accumulated deficit. We anticipate further losses in the foreseeable future. We also had negative cash flows used in operations. These factors raise substantial doubt about our ability to continue as a going concern.
We filed a shelf Registration Statement on Form S-3 that has been declared effective by the Securities and Exchange Commission (“SEC”). On May 12, 2023, we entered into an At Market Issuance Sales Agreement (the “Sales Agreement”) with B. Riley Securities, Inc. (the “Agent”) pursuant to which we may offer and sell, from time to time through the Agent, shares of our common stock, par value $
In addition, on May 10, 2023, we entered into a Non-Revolving Line of Credit Loan Agreement with several institutions and individuals for aggregate loans of up to $
6
Based on the available cash balance at March 31, 2023, and these new sources of funding, we believe that we will have sufficient resources to fund our operations for at least twelve months from the date these financial statements were issued and that the substantial doubt in connection with our ability to continue as a going concern is alleviated.
NOTE 2 – SUMMARY OF SIGNIFICANT ACCOUNTING POLICIES
Interim Financial Statements
The following (a) condensed consolidated balance sheet as of September 30, 2022, which has been derived from our audited financial statements, and (b) our unaudited condensed consolidated interim financial statements for the six months ended March 31, 2023, have been prepared in accordance with accounting principles generally accepted in the United States ("US GAAP") for interim financial information and the instructions to Form 10-Q and Rule 8-03 of Regulation S-X of the Securities Act of 1933. Accordingly, they do not include all of the information and footnotes required by US GAAP for complete financial statements. In the opinion of management, all adjustments (consisting of normal recurring accruals) considered necessary for a fair presentation have been included. Operating results for the six months ended March 31, 2023, are not necessarily indicative of results that may be expected for the year ending September 30, 2023.
These unaudited condensed consolidated financial statements should be read in conjunction with the audited consolidated financial statements and notes thereto for the year ended September 30, 2022, included in our Annual Report on Form 10-K filed with the SEC on December 20, 2022.
Basis of presentation
The consolidated financial statements include our accounts and our wholly-owned subsidiaries, EON Media Group Pte. Ltd. and Retail Media TV, Inc. The unaudited condensed consolidated financial statements are prepared using the accrual basis of accounting in accordance with US GAAP. All inter-company transactions and balances have been eliminated on consolidation.
Use of estimates
The preparation of the unaudited condensed consolidated financial statements in conformity with US GAAP requires management to make estimates and assumptions that affect the reported amounts of assets and liabilities and disclosure of contingent assets and liabilities at the date of the financial statements and the reported amounts of revenue and expenses during the reporting period. Actual results could differ from those estimates. Significant estimates include assumptions used in the revenue recognition of performance obligations, allowance for doubtful accounts, fair value of stock-based compensation awards, income taxes and going concern.
Segment reporting
We report as
Cash
Cash and cash equivalents include all highly liquid monetary instruments with original maturities of three months or less when purchased. These investments are carried at cost, which approximates fair value. Financial instruments that potentially subject us to concentrations of credit risk consist primarily of cash deposits. We maintain our cash in institutions insured by the Federal Deposit Insurance Corporation (“FDIC”). At times, our cash and cash equivalent balances may be uninsured or in amounts that exceed the FDIC insurance limits. We have not experienced any losses on such accounts. On March 31, 2023, and September 30, 2022, we had
7
As of March 31, 2023, and September 30, 2022, approximately $
Accounts receivable
Accounts receivable represent amounts due from customers. We assess the collectability of receivables on an ongoing basis. A provision for the impairment of receivables involves significant management judgment and includes the review of individual receivables based on individual customers, current economic trends and analysis of historical bad debts. As of March 31, 2023, and September 30, 2022, we had recorded an allowance for doubtful accounts of $
Concentration of credit risk
During the six months ended March 31, 2023, we had
As of March 31, 2023,
We grant credit in the normal course of business to our customers. Periodically, we review past due accounts and make decisions about future credit on a customer-by-customer basis. Credit risk is the risk that one party to a financial instrument will cause a loss for the other party by failing to discharge an obligation.
Prepaid expenses
Expenditures paid in one accounting period which will not be consumed until a future period such as insurance premiums and annual subscription fees are accounted for on the balance sheet as a prepaid expense. When the asset is eventually consumed, it is charged to expense.
Content Assets
We capitalize the fixed content fees and corresponding liability when the license period begins, the cost of the content is known, and the content is accepted and available for streaming. If the licensing fee is not determinable or reasonably estimable, no asset or liability is recorded, and licensing costs are expensed as incurred. We amortize licensed content assets into cost of revenue, using the straight-line method over the contractual period of availability. The liability is paid in accordance with the contractual terms of the arrangement. Internally-developed content costs are capitalized in the same manner as licensed content costs, when the cost of the content is known and the content is ready and available for streaming. We amortize internally-developed content assets into cost of revenue, using the straight-line method over the estimated period of streaming.
Long-lived assets
We evaluate the recoverability of long-lived assets, including intangible assets, for impairment when events or changes in circumstances indicate that the carrying amount of an asset may not be recoverable. Conditions that would necessitate an impairment assessment include a significant decline in the observable market value of an asset, a significant change in the extent or manner that an asset is used, or a significant adverse change that would indicate that the carrying amount of an asset or group of assets is not recoverable. For long-lived assets to be held and used, we recognize an impairment loss only if their carrying amount is not recoverable through the undiscounted cash flows. The impairment loss is based on the difference between the carrying amount and estimated fair value as determined by discounted future cash flows. Our finite long-lived intangible assets are amortized on a straight-line basis over their estimated useful lives, which range from to .
8
Property and equipment, net
Property and equipment are stated at cost, less accumulated depreciation. Depreciation is calculated using the straight-line method over the asset’s estimated useful life. Our capitalization policy is to capitalize property and equipment purchases greater than $
Loop players are capitalized as fixed assets and depreciated over the estimated period of use.
See below for estimated useful lives:
Loop players | ||
Equipment |
| |
Software |
Operating leases
We determine if an arrangement is a lease at inception. Operating lease right-of-use assets (“ROU assets”) and short-term and long-term lease liabilities are included on the face of the consolidated balance sheet.
ROU assets represent the right to use an underlying asset for the lease term and lease liabilities represent our obligation to make lease payments arising from the lease. Operating lease ROU assets and liabilities are recognized at commencement date based on the present value of lease payments over the lease term. As most of our leases do not provide an implicit rate, we use an incremental borrowing rate based on the information available at commencement date in determining the present value of lease payments. Our lease terms may include options to extend or terminate the lease when it is reasonably certain that we will exercise that option. Lease expense for lease payments is recognized on a straight-line basis over the lease term. We have lease agreements with lease and non-lease components, which are accounted for as a single lease component. For lease agreements with terms less than twelve months, we have elected the short-term lease measurement and recognition exemption, and we recognize such lease payments on a straight-line basis over the lease term.
Fair value measurement
We determine the fair value of our assets and liabilities using a hierarchy established by the accounting guidance that prioritizes the inputs to valuation techniques used to measure fair value. The hierarchy gives the highest priority to valuations based upon unadjusted quoted prices in active markets for identical assets or liabilities (Level 1 measurements) and the lowest priority to valuations based upon unobservable inputs that are significant to the valuation (Level 3 measurements). The three levels of valuation hierarchy are defined as follows:
| ● | Level 1 inputs to the valuation methodology are quoted prices for identical assets or liabilities in active markets. |
| ● | Level 2 inputs to the valuation methodology included quoted prices for similar assets and liabilities in active markets, quoted prices for identical or similar assets in inactive markets, and inputs that are observable for the asset or liability, either directly or indirectly, for substantially the full term of the financial instrument. |
| ● | Level 3 inputs to the valuation methodology is one or more unobservable inputs which are significant to the fair value measurement. |
The carrying amount of our financial instruments, including cash, accounts receivable, deposits, short-term portion of notes receivable and notes payable, and current liabilities approximate fair value due to their short-term nature. We do not have financial assets or liabilities that are required under US GAAP to be measured at fair value on a recurring
9
basis. We have not elected to use fair value measurement option for any assets or liabilities for which fair value measurement is not presently required.
We record assets and liabilities at fair value on a nonrecurring basis as required by US GAAP. Assets recognized or disclosed at fair value in the condensed consolidated financial statements on a nonrecurring basis include items such as property and equipment, operating lease assets, goodwill, and other intangible assets, which are measured at fair value if determined to be impaired.
On September 26, 2022, our convertible debentures converted to common stock as part of our public offering and uplist to the NYSE stock exchange, and in accordance with the terms of the original debt agreements. As of September 30, 2022, the remaining balance of the derivative liability was written off as part of the conversion to equity. Thus, there is
The following table summarizes changes in fair value measurements of the Derivative Liability during the six months ended March 31, 2022:
Balance as of September 30, 2021 | $ | | |
Derivative liability issued with convertible debentures |
| — | |
Change in fair value |
| ( | |
Balance as of March 31, 2022 | $ | |
Advertising costs
We expense all advertising costs as incurred. Advertising and marketing costs for the six months ended March 31, 2023, and 2022, were $
Revenue recognition
We recognize revenue in accordance with ASC 606, Revenue from Contracts with Customers, when it satisfies a performance obligation by transferring control over a product to a customer. Revenue is measured based on the consideration we expect to receive in exchange for those products. In instances where final acceptance of the product is specified by the client, revenue is deferred until all acceptance criteria have been met. For example, we bill subscription services in advance of when the service is performed and revenue is treated as deferred revenue until the service is performed and/or the performance obligation is satisfied. Revenues are recognized under Topic 606 in a manner that reasonably reflects the delivery of our products and services to clients in return for expected consideration and includes the following elements:
| ● | executed contracts with our customers that we believe are legally enforceable; |
| ● | identification of performance obligations in the respective contract; |
| ● | determination of the transaction price for each performance obligation in the respective contract; |
| ● | allocation of the transaction price to each performance obligation; and |
| ● | recognition of revenue only when we satisfy each performance obligation. |
Performance obligations and significant judgments
Our revenue can be categorized into two revenue streams: Advertising revenue and Legacy and other revenue.
10
The following table disaggregates our revenue by major type for the three and six months ended March 31, 2023, and 2022.
Three months ended March 31, | Six months ended March 31, | |||||||||||
2023 | 2022 | 2023 | 2022 | |||||||||
Advertising revenue | $ | | $ | | $ | | $ | | ||||
Legacy and other revenue | | | | | ||||||||
Total | $ | | $ | | $ | | $ | | ||||
Our performance obligations and recognition patterns for each revenue stream are as follows:
Advertising revenue
For the three and six months ended March 31, 2023, advertising revenue accounts for
For all advertising revenue sources, we evaluate whether we should be considered the principal (i.e., report revenues on a gross basis) or an agent (i.e., report revenues on a net basis). Our role as principal or agent differs based on our performance obligation for each revenue share arrangement.
For both the O&O and Platform Partner businesses, advertising inventory provided to advertisers through the use of an advertising demand partner or agency, with whose fees or commission is calculated based on a stated percentage of gross advertising spending, we are considered the agent and our revenues are reported net of agency fees and commissions. We are considered the agent because the demand partner or agency controls all aspects of the transaction (pricing risk, inventory risk, obligation for fulfillment) except for the devices used to show the advertisements, therefore we report this advertising revenue net of agency fees and commissions.
We are considered the principal in our arrangements with content providers in our O&O Platform business and with our arrangements with our third-party partners in our Partner Platforms business and thus report revenues on a gross basis (net of agency fees and commissions), wherein the amounts billed to our advertising demand partners, advertising agencies, and direct advertisers and sponsors are recorded as revenues, and amounts paid to content providers and third-party partners are recorded as expenses. We are considered the principal because we control the advertising space, are primarily responsible to our advertising demand partners and other parties filling our advertising inventory, have discretion in pricing and advertising fill rates and typically have an inventory risk.
For advertising revenue, we recognize revenue at the time the digital advertising impressions are filled and the advertisements are played and, for sponsorship revenue, we generally recognize revenue ratably over the term of the sponsorship arrangement as the sponsored advertisements are played.
Legacy and other business revenue
For the three and six months ended March 31, 2023, legacy and other business revenue accounts for the remaining
| o | Delivery of streaming services including content encoding and hosting. We recognize revenue over the term of the service based on bandwidth usage. Revenue from streaming services is insignificant. |
| o | Delivery of subscription content services in customized formats. We recognize revenue straight-line over the term of the service. |
11
| o | Delivery of hardware for ongoing subscription content delivery through software. We recognize revenue at the point of hardware delivery. Revenue from hardware sales is insignificant. |
Transaction prices for performance obligations are explicitly outlined in relevant agreements; therefore, we do not believe that significant judgments are required with respect to the determination of the transaction price, including any variable consideration identified.
Customer acquisition costs
Customer acquisition costs consist of marketing costs and affiliate fees associated with the O&O business. They are included in operating expenses and expensed as incurred.
Cost of revenue
Cost of revenue for the O&O Platform and legacy businesses represents the amortized cost of ongoing licensing and hosting fees, which is recognized over time based on usage patterns. The depreciation expense associated with the Loop players is not included in cost of sales.
Cost of revenue for the Partner Platform business represents hosting fees, amortized costs of internally-developed content, and the revenue share with third party partners (after deduction of allocated infrastructure costs). The cost of revenue is higher with partners within the Partner Platform versus those within the O&O Platform because the Company leverages its Partner Platform partners’ network of customers and their screens to deliver content and advertising inventory, rather than using its own Loop players.
Deferred income
As of March 31, 2023, we no longer bill subscription services in advance of when the service period is performed. The deferred income recorded at September 30, 2022, represents our accounting for the timing difference between when the subscription fees are received and when the performance obligation is satisfied.
Net loss per share
We account for net loss per share in accordance with ASC subtopic 260-10, Earnings Per Share (“ASC 260-10”), which requires presentation of basic and diluted earnings per share (“EPS”) on the face of the statement of operations for all entities with complex capital structures and requires a reconciliation of the numerator and denominator of the basic EPS computation to the numerator and denominator of the diluted EPS.
Basic net loss per share is computed by dividing net loss attributable to common stockholders by the weighted average number of shares of common stock outstanding during each period. It excludes the dilutive effects of any potentially issuable common shares.
Diluted net loss per share is calculated by including any potentially dilutive share issuances in the denominator.
12
The following securities are excluded from the calculation of weighted average diluted shares at March 31, 2023, and September 30, 2022, respectively, because their inclusion would have been anti-dilutive.
| March 31, |
| September 30, | |
2023 | 2022 | |||
Options to purchase common stock |
| |
| |
Warrants to purchase common stock |
| |
| |
Restricted Stock Units (RSUs) | | | ||
Series A preferred stock |
| — |
| — |
Series B preferred stock |
| — |
| — |
Convertible debentures |
| — |
| — |
Total common stock equivalents |
| |
| |
Shipping and handling costs
Loop players are provided free to our customers. Loop absorbs any associated costs of shipping and handling and records as an operational expense at the time of service.
Income taxes
We account for income taxes in accordance with ASC Topic 740, Income Taxes. ASC 740 requires a company to use the asset and liability method of accounting for income taxes, whereby deferred tax assets are recognized for deductible temporary differences, and deferred tax liabilities are recognized for taxable temporary differences. Temporary differences are the differences between the reported amounts of assets and liabilities and their tax bases. Deferred tax assets are reduced by a valuation allowance when, in the opinion of management, it is more likely than not that some portion, or all of, the deferred tax assets will not be realized. Deferred tax assets and liabilities are adjusted for the effect of changes in tax laws and rates on the date of enactment.
Under ASC 740, a tax position is recognized as a benefit only if it is “more likely than not” that the tax position would be sustained in a tax examination, with a tax examination being presumed to occur. The amount recognized is the largest amount of tax benefit that is greater than 50% likely of being realized on examination. For tax positions not meeting the “more likely than not” test, no tax benefit is recorded. We have no material uncertain tax positions for any of the reporting periods presented.
We recognize accrued interest and penalties related to unrecognized tax benefits as part of income tax expense. We have also made a policy election to treat the income tax with respect to global intangible low-tax income as a period expense when incurred.
In December 2019, the FASB issued ASU No. 2019-12, Simplifying the Accounting for Income Taxes, as part of its initiative to reduce complexity in accounting standards. The amendments in the ASU are effective for fiscal years beginning after December 15, 2020, including interim periods therein. The adoption of this standard in the first quarter of 2022 had no impact on our consolidated financial statements.
Stock-based compensation
Stock-based compensation issued to employees is measured at the grant date, based on the fair value of the award, and is recognized as an expense over the requisite service period. We measure the fair value of the stock-based compensation issued to non-employees using the stock price observed in the trading market (for stock transactions) or the fair value of the award (for non-stock transactions), which were more reliably determinable measures of fair value than the value of the services being rendered. The measurement date is the earlier of (1) the date at which commitment for performance by the counterparty to earn the equity instruments is reached, or (2) the date at which the counterparty’s performance is complete.
13
Reclassifications
Certain prior year amounts have been reclassified to conform to current year presentation. These reclassifications have no effect on the previously reported financial position, results of operations, or cash flows. Previously reported accounts payable and accrued liabilities have now been disaggregated into accounts payable, accrued liabilities, and accrued royalty. Further, stock-based compensation and depreciation and amortization expenses have now been segregated from sales, general and administrative expenses and separately reported within operating expenses.
Recently adopted accounting pronouncements
In August 2020, the FASB issued ASU 2020-06, Debt – Debt with Conversion and Other Options (Subtopic 470-20) and Derivatives and Hedging – Contracts in Entity’s Own Equity (Subtopic 815-40). This ASU reduces the number of accounting models for convertible debt instruments and convertible preferred stock. As well as amend the guidance for the derivatives scope exception for contracts in an entity’s own equity to reduce form-over-substance-based accounting conclusions. In addition, this ASU improves and amends the related EPS guidance. The ASU is effective for interim and annual periods beginning after December 15, 2021, with early adoption permitted for periods beginning after December 15, 2020. Adoption of the ASU can either be on a modified retrospective or full retrospective basis. We adopted this ASU as of October 1, 2022, and there is no material impact as of March 31, 2023.
Recent accounting pronouncements
In September 2016, the FASB issued ASU 2016-13, Financial Instruments - Credit Losses (Topic 326): Measurement of Credit Losses on Financial Instruments. This guidance requires the measurement of all expected credit losses for financial assets held at the reporting date based on historical experience, current conditions and reasonable and supportable forecasts. This guidance also requires enhanced disclosures regarding significant estimates and judgments used in estimating credit losses. The new guidance is effective for fiscal years beginning after December 15, 2022. We are currently evaluating the impact of this standard on our condensed consolidated financial statements and related disclosures.
NOTE 3 – CONTENT ASSETS
Content Assets
The content we stream to our users is generally acquired by securing the intellectual property rights to the content through licenses from, and paying royalties or other consideration to, rights holders or their agents. The licensing can be for a fixed fee or can be a revenue sharing arrangement. The licensing arrangements specify the period when the content is available for streaming, the territories, the platforms, the fee structure and other standard content licensing terms defining the rights and/or restrictions for how the licensed content can be used by Loop. We also develop original content internally, which is capitalized when the content is ready and available for streaming, and generally amortized over a period of to
As of March 31, 2023, content assets were $
We recorded amortization expense in cost of revenue, in the consolidated statements of operations, related to capitalized content assets:
| ||||||||||||
Three months ended March 31, | Six months ended March 31, | |||||||||||
2023 |
| 2022 | 2023 |
| 2022 | |||||||
Licensed Content Assets | $ | | $ | | $ | | $ | | ||||
Internally-Developed Assets | | — | | — | ||||||||
Total | $ | | $ | | $ | | $ | | ||||
14
Our content license contracts are typically to
Remaining in Fiscal Year 2023 | Fiscal Year 2024 | Fiscal Year 2025 | Fiscal Year 2026 | |||||||||
Licensed Content Assets | $ | | $ | | $ | | $ | | ||||
Internally-Developed Assets |
| |
| |
| |
| | ||||
Total | $ | | $ | | $ | | $ | | ||||
License Content Liabilities
On March 31, 2023, we had $
NOTE 4. PROPERTY AND EQUIPMENT
Our property and equipment, net consisted of the following as of March 31, 2023, and September 30, 2022:
| March 31, |
| September 30, | |||
2023 | 2022 | |||||
Loop Players | $ | | $ | | ||
Equipment | | | ||||
Software |
| |
| | ||
| |
| | |||
Less: accumulated depreciation |
| ( |
| ( | ||
Total property and equipment, net | $ | | $ | | ||
For the three months ended March 31, 2023, and 2022, depreciation expense, calculated using straight line method, charged to operations amounted to $
For the six months ended March 31, 2023, and 2022, depreciation expense, calculated using straight line method, charged to operations amounted to $
NOTE 5. INTANGIBLE ASSETS
Our intangible assets, each definite lived assets, consisted of the following as of March 31, 2023, and September 30, 2022:
March 31, |
| September 30, | ||||||
| Useful life |
| 2023 |
| 2022 | |||
Customer relationships | $ | | $ | | ||||
Content library |
| |
| | ||||
Total intangible assets, gross |
| |
| | ||||
Less: accumulated amortization |
| ( |
| ( | ||||
Total |
| ( |
| ( | ||||
Total intangible assets, net | $ | | $ | | ||||
15
Amortization expense charged to operations amounted to $
Amortization expense charged to operations amounted to $
Annual amortization expense for the next five years and thereafter is estimated to be $
NOTE 6 – OPERATING LEASES
Operating leases
We have operating leases for office space and office equipment. Many leases include one or more options to renew, some of which include options to extend the leases for a long-term period, and some leases include options to terminate the leases within 30 days. In certain of our lease agreements, the rental payments are adjusted periodically to reflect actual charges incurred for capital area maintenance, utilities, inflation and/or changes in other indexes.
Our lease liability consisted of the following as of March 31, 2023, and September 30, 2022:
| March 31, |
| September 30, | |||
2023 | 2022 | |||||
Short term portion | $ | | $ | | ||
Long term portion |
| — |
| — | ||
Total lease liability | $ | | $ | | ||
Maturity analysis under these lease agreements are as follows:
| |||
2023 | $ | | |
Total undiscounted cash flows |
| | |
Less: 10% Present value discount |
| ( | |
Lease liability | $ | |
We recorded lease expense in sales, general and administration expenses in the consolidated statement of operations:
Three months ended March 31, | Six months ended March 31, | |||||||||||
| 2023 |
| 2022 | 2023 |
| 2022 | ||||||
Operating lease expense | $ | | $ | | $ | | $ | | ||||
Short-term lease expense |
| |
| |
| |
| | ||||
Total lease expense | $ | | $ | | $ | | $ | | ||||
For the six months ended March 31, 2023, cash payments against lease liabilities totaled $
For the six months ended March 31, 2022, cash payments against lease liabilities totaled $
16
Weighted-average remaining lease term and discount rate for operating leases are as follows:
Weighted-average remaining lease term |
| ||
Weighted-average discount rate |
| | % |
NOTE 7 – ACCOUNTS PAYABLE AND ACCRUED EXPENSES
Accounts payable and accrued expenses consisted of the following as of March 31, 2023, and September 30, 2021:
| March 31, |
| September 30, | |||
2023 | 2022 | |||||
Accounts payable | $ | | $ | | ||
Performance bonuses |
| | | |||
Professional fees | | | ||||
Interest payable | |
| | |||
Marketing | | | ||||
Insurance liabilities |
| |
| | ||
Commissions | | | ||||
Other accrued liabilities | | | ||||
Accrued liabilities |
| |
| | ||
Accrued royalties and revenue share | | | ||||
Total accounts payable and accrued expenses | $ | | $ | | ||
17
NOTE 8 – DEBT
Lines of Credit as of March 31, 2023: | |||||||||||||||
Unpaid | Contractual | ||||||||||||||
Net Carrying Value | Principal | Interest Rates | Contractual | Warrants | |||||||||||
Related party lines of credit: | Current | Long Term | Balance | Cash | Maturity Date | issued | |||||||||
$ | (1) | $ | — | $ | | $ | | | |||||||
Total related party lines of credit, net | $ | — | $ | | $ | | |||||||||
Lines of credit: | |||||||||||||||
$ | (2) | $ | | $ | — | $ | | | |||||||
$ | — | | | Greater of | — | ||||||||||
Total lines of credit, net | $ | | $ | | $ | | |||||||||
Lines of Credit as of September 30, 2022: | |||||||||||||||
Unpaid | Contractual | ||||||||||||||
Net Carrying Value | Principal | Interest Rates | Contractual | Warrants | |||||||||||
Related party lines of credit: | Current | Long Term | Balance | Cash | Maturity Date | issued | |||||||||
$ | (1) | $ | — | $ | | $ | | | |||||||
Total related party lines of credit, net | $ | — | $ | | $ | | |||||||||
Lines of credit: | |||||||||||||||
$ | (2) | $ | — | $ | | $ | | | |||||||
$ | — | | | Greater of | — | ||||||||||
Total lines of credit, net | $ | — | $ | | $ | | |||||||||
18
The following table presents the interest expense related to the contractual interest coupon and the amortization of debt discounts on the lines of credit:
Three months ended March 31, | Six months ended March 31, | |||||||||||
2023 | 2022 | 2023 | 2022 | |||||||||
Interest expense | $ | $ | | $ | $ | | ||||||
Amortization of debt discounts | | | ||||||||||
Total | $ | | $ | | $ | | $ | | ||||
Maturity analysis under the line of credit agreements for the fiscal years ended September 30, | ||||||||||||
2023 | $ | — | ||||||||||
2024 | | |||||||||||
2025 | — | |||||||||||
2026 | — | |||||||||||
2027 | — | |||||||||||
Lines of credit, related and non-related party | | |||||||||||
Less: Debt discount on lines of credit payable | ( | |||||||||||
Total Lines of credit payable, related and non-related party, net | $ | | ||||||||||
Non-Revolving Lines of Credit
On February 23, 2022, we entered into a Non-Revolving Line of Credit Loan Agreement (the “Prior Excel Loan Agreement”) with Excel Family Partnership, LLLP (“Excel”), an entity managed by Bruce Cassidy, Chairman of our Board of Directors, for aggregate principal amount of $
19
Credit Promissory Note Amendment No. 2 with Excel to extend the maturity date of the Excel Non-Revolving Loan from (24) months to (25) months from the date of the Excel Non-Revolving Loan.
The Excel Non-Revolving Loan had a balance, including accrued interest, amounting to $
Effective as of May 13, 2022, we entered into a Non-Revolving Line of Credit Loan Agreement (the “RAT Non-Revolving Loan Agreement”) with several institutions and individuals and RAT Investment Holdings, LP, as administrator of the loan (the “Loan Administrator”) for an aggregate principal amount of $
The warrants were accounted for as equity awards. We allocated the debt and warrant on a relative fair value basis to the proceeds received for the non-revolving lines of credit. We further allocated the fair value of $
The RAT Non-Revolving Loan had a balance, including accrued interest, amounting to $
Revolving Loan Agreement
Effective as of July 29, 2022, we entered into a Loan and Security Agreement (the “Revolving Loan Agreement”) with Industrial Funding Group, Inc. (the “Initial Lender”) for a revolving loan credit facility for the initial principal sum of up to $
20
Rates” column of The Wall Street Journal, adjusted as and when such Prime Rate changes, plus (ii) zero percent (
The warrants were accounted for as equity awards. We allocated the debt and warrant on a relative fair value basis to the proceeds received for the revolving loan agreement. We further allocated the fair value of the $
The Revolving Loan had a balance, including accrued interest, amounting to $
21
NOTE 9 – COMMITMENTS AND CONTINGENCIES
We may be involved in legal proceedings, claims and assessments arising in the ordinary course of business. Such matters are subject to many uncertainties, and outcomes are not predictable with assurance. There are
NOTE 10 – RELATED PARTY TRANSACTIONS
Related parties are natural persons or other entities that have the ability, directly or indirectly, to control another party or exercise significant influence over the party making financial and operating decisions. Related parties include other parties that are subject to common control or that are subject to common significant influences.
Revolving Loan Agreement
Effective as of July 29, 2022, we entered into the Revolving Loan Agreement. In connection with the loan under the Revolving Loan Agreement, the Subordinated Lenders delivered Subordination Agreements to the Senior Lender. In connection with the delivery of the Subordination Agreements by the Subordinated Lenders, on July 29, 2022, we issued warrants to each Subordinated Lender on identical terms for an aggregate of up to
Excel Non-Revolving Loan Agreement
On February 23, 2022, we entered into the Prior Excel Loan Agreement with Excel, an entity managed by Bruce Cassidy, Chairman of our Board of Directors, for the $2m Loan (aggregate principal amount of $
The Excel Non-Revolving Loan had a balance, including accrued interest, amounting to $
22
500 Limited
For the six months ended March 31, 2023, and 2022, we paid 500 Limited $
NOTE 11 –STOCKHOLDERS’ EQUITY (DEFICIT)
Change in Number of Authorized and Outstanding Shares
On September 21, 2022, a 1 for
Common stock
Our authorized capital stock consists of
Six months ended March 31, 2023
There was no activity during the six months ended March 31, 2023.
See Note 12 – Stock Options and Warrants for stock compensation discussion.
Six months ended March 31, 2022
During the six months ended March 31, 2022, we issued
See Note 12 – Stock Options and Warrants for stock compensation discussion.
NOTE 12 – STOCK OPTIONS, RESTRICTED STOCK UNITS (RSUs) AND WARRANTS
Options
Option valuation models require the input of highly subjective assumptions. The fair value of stock-based payment awards was estimated using the Black-Scholes option model with a volatility figure derived from using our historical stock prices. We account for the expected life of options based on the contractual life of options for non-employees. For employees, we account for the expected life of options in accordance with the “simplified” method, which is used for “plain-vanilla” options, as defined in the accounting standards codification. The risk-free interest rate was determined from the implied yields of U.S. Treasury zero-coupon bonds with a remaining life consistent with the expected term of the options.
23
The following table summarizes the stock option activity for the six months ended March 31, 2023:
Weighted | Weighted Average | |||||||||
Average | Remaining | Aggregate | ||||||||
| Options |
| Exercise Price |
| Contractual Term |
| Intrinsic Value | |||
Outstanding at September 30, 2022 |
| | $ | |
| $ | | |||
Grants |
| |
| |
| — | ||||
Exercised |
| — |
| — |
| — |
| — | ||
Expired |
| — |
| — |
| — |
| — | ||
Forfeited |
| ( |
| |
| — |
| — | ||
Outstanding at March 31, 2023 |
| | $ | |
| $ | | |||
Exercisable at March 31, 2023 |
| | $ | |
| $ | | |||
The aggregate intrinsic value in the preceding tables represents the total pretax intrinsic value, based on options with an exercise price less than our stock price of $
The following table presents information related to stock options as of March 31, 2023:
Options outstanding | |||||||
Weighted | Options | ||||||
average | exercisable | ||||||
Exercise | Number of | remaining life | number of | ||||
price |
| options |
| in years |
| options | |
$ | | | |||||
| | ||||||
| | ||||||
| | ||||||
| | ||||||
| | ||||||
| | ||||||
| | ||||||
| | ||||||
| | ||||||
| | ||||||
| | ||||||
| — | ||||||
| — | ||||||
| — | ||||||
| — | ||||||
| | ||||||
| | ||||||
| | ||||||
Stock-based compensation
We recognize compensation expense for all stock options granted using the fair value-based method of accounting. During the six months ended March 31, 2023, we issued
24
The stock-based compensation expense related to option grants was $
Restricted Stock Units
On September 18, 2022, the Compensation Committee of our Board of Directors approved Restricted Stock Unit (“RSU”) awards to certain officers and key employees pursuant to the terms of the Loop Media, Inc. Amended and Restated 2020 Equity Incentive Compensation Plan. On September 22, 2022, we granted an aggregate of
The following table summarizes the RSU activity for the six months ended March 31, 2023:
Weighted | Weighted Average | |||||||||
Average | Remaining | Aggregate | ||||||||
RSUs |
| Fair Value |
| Contractual Term |
| Intrinsic Value | ||||
Outstanding at September 30, 2022 | | $ | |
| $ | | ||||
Grants | |
| |
| | |||||
Exercised | — |
| — |
| — |
| — | |||
Expired | — |
| — |
| — |
| — | |||
Forfeited | — |
| — |
| — |
| — | |||
Outstanding at March 31, 2023 | | $ | |
| — | $ | | |||
Exercisable at March 31, 2023 | — | $ | — |
| — | $ | — | |||
The aggregate intrinsic value in the preceding tables represents the total pretax intrinsic value, based on our stock price of $
The following table presents information related to RSUs as of March 31, 2023:
RSUs outstanding | ||||||||||
Weighted Average | ||||||||||
Grant Date | Number of | Remaining | Number of | |||||||
Fair Value |
| RSUs |
| Life in Years |
| RSUs Vested | ||||
$ | | |
| — | ||||||
$ | |
| |
| — | |||||
$ | |
| |
|
| — | ||||
|
| — | ||||||||
The stock-based compensation expense related to RSU grants was $
As of March 31, 2023, the total compensation cost related to nonvested RSU awards not yet recognized was $
25
Warrants
The following table summarizes the changes in warrants outstanding and the related prices for the shares of our common stock:
Warrants outstanding | Warrants exercisable | |||||||||||
Weighted | Weighted | |||||||||||
average | average | |||||||||||
remaining | Weighted | remaining | ||||||||||
contractual | average | contractual | ||||||||||
Number | life | exercise | Number | life | ||||||||
Exercise prices |
| outstanding |
| (years) | price |
| exercisable |
| (years) | |||
$ | | | | |||||||||
| | | ||||||||||
| | | ||||||||||
| | | ||||||||||
| | | ||||||||||
| | | ||||||||||
| | | ||||||||||
| | | ||||||||||
| | | ||||||||||
| | | ||||||||||
| | | ||||||||||
| | | ||||||||||
| | | ||||||||||
| | | ||||||||||
The following table summarizes the warrant activity for the six months ended March 31, 2023:
|
| Weighted | |||
average | |||||
exercise | |||||
Number of | price per | ||||
shares | share | ||||
Outstanding at September 30, 2022 | | $ | | ||
Issued | — | — | |||
Exercised | — | — | |||
Expired | — | — | |||
Outstanding at March 31, 2023 |
| | $ | | |
We record all warrants granted using the fair value-based method of accounting.
During the six months ended March 31, 2023,
NOTE 13 – INCOME TAXES
We calculate our interim income tax provision in accordance with ASC Topic 270, Interim Reporting and ASC Topic 740, Accounting for Income Taxes. At the end of each interim period, we estimate the annual effective tax rate and apply that rate to our ordinary year to date earnings. In addition, the tax effects of unusual or infrequently occurring items including changes in judgment about valuation allowances and effects of changes in enacted tax laws are recognized discretely in the interim period in which the change occurs. The computation of the annual estimated effective tax rate at each interim period requires certain estimates and significant judgment including the expected operating (loss) income for the year, permanent and temporary differences as a result of differences between amounts measured and recognized in accordance with tax laws and financial accounting standards, and the likelihood of recovering deferred tax assets generated
26
in the current fiscal year. The accounting estimates used to compute income tax expense may change as new events occur or additional information is obtained.
For the six months ended March 31, 2023, we recorded an income tax provision of $
For the three months ended March 31, 2023, we recorded an income tax provision of $
NOTE 14 – SUBSEQUENT EVENTS
We have evaluated all subsequent events through the date of this report on Form 10-Q with the SEC, to ensure that this filing includes appropriate disclosure of events both recognized in the financial statements as of March 31, 2023, and events which occurred after March 31, 2023, but which were not recognized in the financial statements.
Debt Issuance
Effective as of May 10, 2023, we entered into a Secured Non-Revolving Line of Credit Loan Agreement (the “2023 Secured Loan Agreement”) with several individuals and institutional lenders (each individually a “Lender” and collectively, the “Lenders”) for aggregate loans of up to $
In connection with the 2023 Secured Loan, on May 10, 2023, we issued warrants (the “Warrants”) to purchase up to an aggregate of
Under the2023 Secured Loan Agreement, we have granted to the Lenders a security interest in all of our present and future assets and properties, real or personal, tangible or intangible, wherever located, including products and proceeds thereof. In connection with the 2023 Secured Loan Agreement, the Lenders delivered subordination agreements (the “Subordination Agreements”) to GemCap Solutions, LLC, as successor and assign to Industrial Funding Group, Inc.(the “Senior Lender” or “GemCap”), pursuant to which our obligations to the Lenders and the indebtedness under the 2023 Secured Loan Agreement are subordinate and junior in right of payment to the indebtedness under our account receivable facility evidenced by that certain Loan and Security Agreement dated as of July 29, 2022, with the Senior Lender.
Excel Family Partners, LLLP (“Excel”), an entity managed by Bruce Cassidy, Chairman of our Board of Directors, is a Lender under the 2023 Secured Loan Agreement for an aggregate loan of $
The issuance of the Warrants was not registered under the Securities Act of 1933, as amended (the “Securities Act”). The Warrants were issued in a private placement exempt from the registration requirements of the Securities Act, in reliance on the exemptions set forth in Section 4(a)(2) of the Securities Act.
27
The descriptions of the Loan Agreement, the Notes, the Subordination Agreements and the Warrants are summaries and are qualified in their entirety by reference to the full texts of the Loan Agreement, the form of Note, the form of Subordination Agreement and the form of Warrant.
Excel Non-Revolving Line of Credit Amendment
Effective as of May 10, 2023, we entered into a Non-Revolving Line of Credit Agreement Amendment No. 2 (the “Excel Line of Credit Amendment No. 2”) and a Non-Revolving Line of Credit Promissory Note Amendment No. 2 (the “Excel Note Amendment No. 2,” and together, the “Excel Non-Revolving Line of Credit Amendments”) with Excel to extend the maturity date of the Excel Non-Revolving Loan from (24) months to (25) months from the date of the Excel Non-Revolving Loan.
The descriptions of the Excel Non-Revolving Line of Credit Amendments are summaries and are qualified in their entirety by reference to the full texts of the Excel Line of Credit Amendment No. 2 and the Excel Note Amendment No. 2.
Shelf Registration ($
We have filed a shelf Registration Statement on Form S-3 that has been declared effective by the Securities and Exchange Commission. On May 12, 2023, we entered into an At Market Issuance Sales Agreement (the “Sales Agreement”) with B. Riley Securities, Inc. (the “Agent”) pursuant to which we may offer and sell, from time to time through the Agent, shares of our common stock, par value $
28
Item 2.Management’s Discussion and Analysis of Financial Condition and Results of Operations.
STATEMENT ON FORWARD-LOOKING INFORMATION
This report (“Report”) on Form 10-Q contains certain forward-looking statements. All statements other than statements of historical fact are “forward-looking statements” for purposes of these provisions, including any projections of earnings, revenues, or other financial items; any statements of the plans, strategies, and objectives of management for future operations; any statements concerning proposed new products, services, or developments; any statements regarding future economic conditions or performance; statements of belief; and any statement of assumptions underlying any of the foregoing. Such forward-looking statements are subject to inherent risks and uncertainties, and actual results could differ materially from those anticipated by the forward-looking statements.
These forward-looking statements involve significant risks and uncertainties, including, but not limited to, the following: competition, promotional costs and risk of declining revenues. Our actual results could differ materially from those anticipated in such forward-looking statements as a result of a number of factors. These forward-looking statements are made as of the date of this filing, and we assume no obligation to update such forward-looking statements. The following discusses our financial condition and results of operations based upon our financial statements which have been prepared in conformity with accounting principles generally accepted in the United States of America. It should be read in conjunction with our financial statements and the notes thereto included elsewhere herein.
The following discussion and analysis provides information which our management believes to be relevant to an assessment and understanding of our results of operations and financial condition. The discussion should be read together with our financial statements and the notes to the financial statements, which are included in this Report.
Overview
We are a multichannel digital video platform media company that uses marketing technology, or “MarTech,” to generate revenue and offer our services. Our technology and vast library of videos and licensed content enable us to curate and distribute short-form videos to out-of-home (“OOH”) dining, hospitality, retail, convenience stores and other locations and venues to enable them to inform, entertain and engage their customers. In addition, our technology provides third-party advertisers with a targeted marketing and promotional tool for their products and services and, in certain instances, allows us to measure the number of potential viewers of such advertising and promotional materials. We also allow OOH clients to access our service without advertisements by paying a monthly subscription fee.
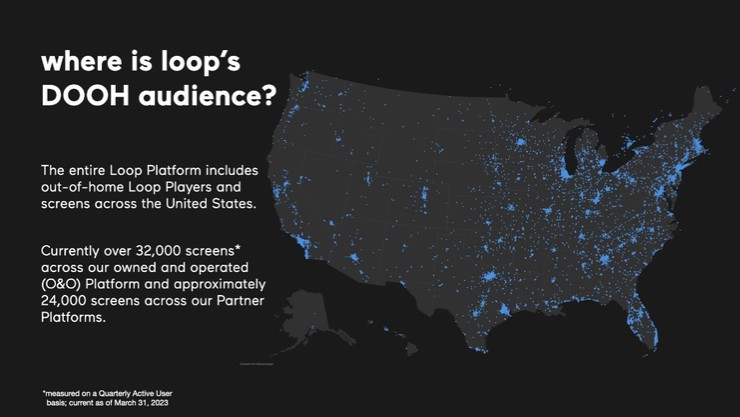
We offer hand-curated music video content licensed from major and independent record labels, including Universal Music Group (“Universal”), Sony Music Entertainment (“Sony”), and Warner Music Group (“Warner” and collectively with Universal and Sony, the “Music Labels”), as well as non-music video content, which is predominantly licensed or acquired from third parties, including action sports clips, drone and atmospheric footage, trivia, news headlines, lifestyle channels and kid-friendly videos, as well as movie, television and video game trailers, amongst other content. We distribute our content and advertising inventory to digital screens located in OOH locations primarily through (i) our owned and operated platform (the “O&O Platform”) of Loop Media-designed “small-box” streaming Android media players (“Loop Players”) and legacy ScreenPlay computers and (ii) through screens on digital networks owned and operated by third parties (each a “Partner Platform” and collectively the “Partner Platforms,” and together with the O&O Platform, the “Loop Platform”). As of March 31, 2023, we had 32,734 QAUs operating on our O&O Platform. See “— Key Performance Indicators.” We launched our Partner Platforms business in May 2022 and have a total of approximately 24,000 screens across our Partner Platforms as of March 31, 2023. In line with our continued focus on business customers, we have deemphasized the distribution of our content channels to consumers in hotel rooms and our arrangement to do so will be ending later this fiscal year.
Key Performance Indicators
We review our quarterly active units (“QAUs”) and average revenue per unit player (“ARPU”), among other key performance indicators, to evaluate our business, measure our performance, identify trends affecting our business, formulate financial projections and make strategic decisions.
29
Quarterly Active Units
We define an “active unit” as (i) an ad-supported Loop Player (or DOOH location using our ad- supported service through our “Loop for Business” application or using an DOOH venue-owned computer screening our content) that is online, used on our O&O Platform, playing content and has checked into the Loop analytics system at least once in the 90-day period or (ii) a DOOH location customer using our subscription service on our O&O Platform at any time during the 90-day period. We use “QAU” to refer to the number of such active units during such period. We do not count towards our QAUs any Loop Players or screens used on our Partner Platform.
For the quarter ended March 31, 2023, QAU was up 22% to 32,734 compared to 26,903 for the quarter ended December 31, 2022. The growth in QAUs was almost entirely the result of growth in our ad-supported Loop Players. This growth was impacted by our increased focus, and the provision of additional resources, to our affiliate program, increased Loop Player requests by certain of our affiliate partners and the introduction of an automated system for our client success team to identify Loop Players that have gone offline to enable us to reengage with the relevant customers and reactivate their Loop Players. QAU was 18,240 for the quarter ended September 30, 2022, 12,584 for the quarter ended June 30, 2022, and 10,530 for the quarter ended March 31, 2022.
Average Revenue Per Unit
We define a “unit player” as (i) an ad-supported Loop Player (or a DOOH location using our ad- supported service through our “Loop for Business” application or using a DOOH location-owned computer screening our content) that is online, used on our O&O Platform, playing content and has checked into the Loop analytics system at least once in the 90-day period or (ii) a DOOH location customer using our paid subscription service on our O&O Platform at any time during the 90-day period. A unit player that is supported by our advertising-based revenue model is an ad-supported unit player and a unit player that is supported by a subscription-based revenue model is a subscription unit player. We calculate advertising ARPU (“AD ARPU”) by dividing quarterly revenues from our DOOH ad-supported service on our O&O Platform for the period by QAUs for our ad-supported unit players on our O&O Platform. We calculate subscription ARPU (“SUB ARPU”) by dividing quarterly revenues from our DOOH subscription-supported service on our O&O Platform for the period by QAUs for our subscription-supported unit players on our O&O Platform. We do not include in our unit players count, AD ARPU or SUB ARPU any Loop Players or screens used on our Partner Platform.
Our AD ARPU fluctuates based on a number of factors, including the length of time in a quarter that a unit player is activated and operating, the CPMs we are able to achieve for our advertising impressions, and the advertising fill rates that we are able to achieve. Our SUB ARPU fluctuates based on a number of factors, including the timing of the start of a customer subscription for a subscription-supported unit player, the number of ad-supported unit players we have, and the price clients pay for those subscriptions. An increase in the number of unit players over the course of a quarterly period may have the effect of decreasing quarterly ARPU, particularly if such players are added towards the end of the quarterly period. Increases or decreases in ARPU may not correspond with increases or decreases in our revenue, and ARPU may be calculated in a manner different than any similar key performance indicator used by other companies.
For the quarter ended March 31, 2023, AD ARPU was $99, compared to $324 for the quarter ended December 31, 2022, a 69% decrease primarily resulting from significantly lower CPMs and decreased fill rates beginning mid-way through November 2022, which offset strong CPMs and fill rates early in the period leading up to the U.S. elections, which had a positive impact on AD ARPU during the quarter. AD ARPU was $356 for the quarter ended September 30, 2022, $526 for the quarter ended June 30, 2022, and $435 for the quarter ended March 31, 2022.
For the quarter ended March 31, 2023, SUB ARPU was $260, compared to $323 for the quarter ended December 31, 2022, a 20% decrease. SUB ARPU was $387 for the quarter ended September 30, 2022, $235 for the quarter ended June 30, 2022, and $429 for the quarter ended March 31, 2022.
30
Components of Results of Operations
Revenue
The majority of our revenue is generated from ad sales, which is recognized at the time the digital advertising impressions are filled and the advertisements are played. Revenue generated from content subscription services in customized formats is recognized over the term of the service. The revenue generated from hardware for ongoing subscription content delivery is recognized at the point of the hardware delivery. Revenue generated from content and streaming services, including content encoding and hosting, are recognized over the term of the service based on bandwidth usage.
Cost of Revenue
Cost of revenue consists of expenses related to licensing, content delivery and technology support. Significant expenses include royalties and license fees paid to content providers as well as network infrastructure and server hosting.
Total Operating Expenses
Operating expenses are attributable to the general overhead related to all the products and services that we provide to our clients and, as a result, they are presented in an aggregate total. Our operating expenses include sales, general and administrative expenses and goodwill impairment.
Sales, General and Administrative Expenses
Sales and marketing expenses consist primarily of employee compensation and related costs associated with our sales and marketing staff, including salaries, benefits, bonuses and commissions as well as costs relating to our marketing and business development. We intend to continue to invest resources in our sales and marketing initiatives to drive growth and extend our market position.
General and administrative expenses consist of employee compensation and related costs for executive, finance, legal, human resources, recruiting, and employee-related information technology and administrative personnel, including salaries, benefits, and bonuses, as well as depreciation, facilities, recruiting and other corporate services.
Other Income/Expense
Interest Expense
Interest expense consists of interest expense on our outstanding indebtedness and amortization of debt issuance costs.
Income Taxes
We account for income taxes in accordance with ASC Topic 740, Income Taxes. ASC 740 requires a company to use the asset and liability method of accounting for income taxes, whereby deferred tax assets are recognized for deductible temporary differences, and deferred tax liabilities are recognized for taxable temporary differences. Temporary differences are the differences between the reported amounts of assets and liabilities and their tax bases. Deferred tax assets are reduced by a valuation allowance when, in the opinion of management, it is more likely than not that some portion, or all of, the deferred tax assets will not be realized. Deferred tax assets and liabilities are adjusted for the effect of changes in tax laws and rates on the date of enactment.
Under ASC 740, a tax position is recognized as a benefit only if it is “more likely than not” that the tax position would be sustained in a tax examination, with a tax examination being presumed to occur. The amount recognized is the largest amount of tax benefit that is greater than 50% likely of being realized on examination.
31
For tax positions not meeting the “more likely than not” test, no tax benefit is recorded. We have no material uncertain tax positions for any of the reporting periods presented.
We recognize accrued interest and penalties related to unrecognized tax benefits as part of income tax expense. We have also made a policy election to treat the income tax with respect to global intangible low-tax income as a period expense when incurred.
In December 2019, the FASB issued ASU No. 2019-12, Simplifying the Accounting for Income Taxes, as part of its initiative to reduce complexity in accounting standards. The amendments in the ASU are effective for fiscal years beginning after December 15, 2020, including interim periods therein. The adoption of this standard in the first quarter of 2022 had no impact on our consolidated financial statements.
Consolidated Results of Operations
The following tables set forth our results of operations for the periods presented. The period-to-period comparison of financial results is not necessarily indicative of future results.
For the three months ended March 31, 2023, compared to the three months ended March 31, 2022:
| Three months ended March 31, | ||||||||||||||||||||||||||||||||||
2023 |
| 2022 |
| $ variance |
| % variance | |||||||||||||||||||||||||||||
Revenue | $ | 5,393,231 |
| $ | 4,879,839 |
| $ | 513,392 |
| 11 | % | ||||||||||||||||||||||||
Cost of revenue | 3,808,150 |
| 3,515,217 |
| 292,933 |
| 8 | % | |||||||||||||||||||||||||||
Gross profit | 1,585,081 |
| 1,364,622 |
| 220,459 |
| 16 | % | |||||||||||||||||||||||||||
Total operating expenses | 10,480,130 |
| 5,891,831 |
| 4,588,299 |
| 78 | % | |||||||||||||||||||||||||||
Loss from operations | (8,895,049) |
| (4,527,209) |
| (4,367,840) |
| 96 | % | |||||||||||||||||||||||||||
Other income (expense): |
|
|
|
|
|
|
| ||||||||||||||||||||||||||||
Interest income | — |
| — |
| — |
| N/A | % | |||||||||||||||||||||||||||
Interest expense | (919,444) |
| (494,389) |
| (425,055) |
| 86 | % | |||||||||||||||||||||||||||
Gain/(Loss) on extinguishment of debt, net | — | — | — | N/A | % | ||||||||||||||||||||||||||||||
Change in fair value of derivatives | — |
| 47,568 |
| (47,568) |
| (100) | % | |||||||||||||||||||||||||||
Other income | (2,624) | — | (2,624) | N/A | % | ||||||||||||||||||||||||||||||
Total other income (expense) | (922,068) |
| (446,821) |
| (475,247) |
| 106 | % | |||||||||||||||||||||||||||
Provision for income taxes | — |
| (800) |
| 800 |
| (100) | % | |||||||||||||||||||||||||||
Net loss | $ | (9,817,117) |
| $ | (4,974,830) |
| $ | (4,842,287) |
| 97 | % | ||||||||||||||||||||||||
Revenue
Our revenue for the three months ended March 31, 2023, was $5,393,231, an increase of $513,392, or 11%, from $4,879,839 for the three months ended March 31, 2022. This increase was primarily driven by significantly more Loop Players deployed into the market, as well as the benefit from our Partner Platform business that was launched in May 2022, offset by a general slowdown in the overall digital advertising spend due to the macro-economic environment.
We’re seeing headwinds in overall digital ad spend that started to emerge in the second half of our quarter ended December 31, 2022, and continued through our quarter ended March 31, 2023. We are not immune to the challenges the broader macro environment presents and its impact on advertising. Similar to many companies that rely on the advertising market, we continue to see industry and macro headwinds in overall digital ad spend due to general industry pressures and continued uncertainty about a potential recession. We believe these headwinds were exacerbated in recent months by the traditional seasonality of advertising, with the three months ending March 31 typically being the slowest calendar quarter for ad sales for us and the market generally. As a result, we have seen revenue and our results of operations negatively impacted.
32
Despite these advertising market and macro headwinds, we delivered over 57,000 active Loop Players/Partner Screens across the Loop Platform for the end of March 2023, which is 5.4 times the 10,530 active Loop Players/Partner Screens for the quarter that ended March 31, 2022. This included approximately 33,000 active Loop Players in our O&O Platform and approximately 24,000 screens across our Partner Platform. This performance continues to validate our distribution model and the appeal of our content and technology stack across various venue types and geographies, which we believe will positively impact our operating results when advertising spend begins to increase.
Given recent challenges in the overall ad market, we have focused our efforts on increased efficiency and cost cutting, while still maintaining our focus on, and dedication to, the continued growth of our business. As a result, we have made cuts and adjustments across several aspects of our business. Part of these changes were coincidentally just the natural result of where we are in our growth cycle, with the downturn in advertising demand and other challenges reinforcing changes that we were looking to make in any event. We are implementing a plan to reduce operating costs, including the reduction of labor and related costs by approximately 20%. Part of this reduction included integrating our Loop Media Studios division into other parts of the business. We also renegotiated or signed content licenses to reduce average content costs and found ways to make our content license margins stronger. In fact, we saw an uplift in margin toward the end of the three months ended March 31, 2023.
Our larger distribution footprint as at March 31, 2023 increased our monthly video impressions viewed, which we estimate to be over 2 billion (based on videos streamed to all of our out of home customer locations and the average number of viewers estimated in each location across our O&O Platform).
We believe our business model of providing free streaming TV to businesses through our free-to-the-user Loop Player will make the distribution growth in our O&O Platform more resilient than a subscription-based business model or one that requires an end user to provide a credit card or other payment information. In addition, we believe our strong track record in digital advertising and the proven business model of acting as a digital advertising sales service provider for third-party partners sets the groundwork for further expansion of our Partner Platform business.
The growth in our distribution has allowed us to make a push into direct ad sales, beyond our traditional sole focus on open exchange programmatic digital advertising. Direct ad sales typically result in higher cost-per-thousand ad impressions (CPMs) for advertising inventory. We believe the scale of our distribution platform and the premium quality of our CTV-like content makes us attractive to companies wishing to advertise in digital media outside of the home. To further these efforts, we have assembled an efficient and focused direct sales team and expect to see the result of their efforts over the course of the second half of our fiscal year ended September 30, 2023. The development of a direct ad sales team is the natural evolution of our business from initial ad revenue growth via programmatic demand which our now larger distribution footprint can support. Direct ad sales typically require a minimum threshold of distribution reach before it can be deemed scalable, and our recent distribution growth has allowed us to generate more interest from a greater number of ad sales buyers. We are pleased to say that we are at this stage of growth and look forward to more of an impact from direct sales in the quarters ahead and becoming less dependent on programmatic advertising demand.
We have also turned our attention to improving our margins by changing the mix of premium content that we play on our O&O Network. In addition, in recent months, we have negotiated new content licenses for certain of our non-music video content, which has allowed us to lower the cost of existing channels and create new lower cost channels. As these agreements start to take effect and if we can drive viewers to these channels, we expect to see improved margins for our non-music video channels as a group in the second half of our fiscal year ended September 30, 2023.
Our customer acquisition cost is primarily influenced by the cost of our digital marketing, as a significant portion of our Loop Player distribution is reliant on OOH locations responding to our online advertisements. In recent months we have placed renewed focus on our affiliate network, which compensates 3rd parties upon the successful installation and operation of our Loop Players and services, which allows us to defer payment for acquiring new customers until they are actually acquired.
We distribute our content and advertising inventory to digital screens located in OOH locations primarily through (i) our owned and operated platform (the “O&O Platform”) of Loop Media-designed “small-box” streaming Android
33
media players and legacy ScreenPlay computers (together, the “Loop Players/Partner Screens”) and (ii) through screens on digital platforms owned and operated by third parties (each a “Partner Platform” and collectively, the “Partner Platforms,” and together with the O&O Platform, the “Loop Platform”). We define an “active” Loop Player as (i) an ad-supported Loop Player (or DOOH location using our ad- supported service through our “Loop for Business” application or using an DOOH venue-owned computer screening our content) that is online, used on our O&O Platform, playing content and has checked into the Loop analytics system at least once in the 90-day period ending on the date of measurement or (ii) a DOOH location customer using our subscription service on our O&O Platform at any time during the 90-day period. We do not count towards our active Loop Players any Loop Players or screens used on our Partner Platforms.
Cost of Revenue
Our cost of revenue for the three months ended March 31, 2023, was $3,808,150, an increase of $292,933, or 8%, from $3,515,217 for the three months ended March 31, 2022. This increase in cost of revenue was primarily due to increased royalties and license fees associated with higher business activities and revenue share arrangements with the Music Labels and content providers. In addition, our network infrastructure and server hosting costs rose primarily due to the expansion of our business and customers using our service.
Gross Profit Margin
Our gross profit margin for the three months ended March 31, 2023, was $1,585,081, an increase of $220,459, or 16%, from $1,364,622 for the three months ended March 31, 2022. This slight increase in gross profit margin was primarily driven by new contracts with reduced average content costs.
Our gross profit margin as a percentage of total revenue for the three months ended March 31, 2023, was approximately 29.4% compared to 28% for the three months ended March 31, 2022. The percentage increase was primarily driven by revenue mix as the year-ago period did not include the launch of our Partner Platform business, which carries lower gross margin but higher operating margin.
The relative contributions to total revenue of our O&O Platform and Partner Platforms businesses will impact our gross profit margin as a percentage of total revenue in future periods, as each of those businesses have different cost of revenue components with a lower gross profit margin in our Partner Platforms business.
Total Operating Expenses
Our operating expenses for the three months ended March 31, 2023, were $10,480,130, an increase of $4,588,299, or 78%, from $5,891,831 for the three months ended March 31, 2022. This increase in operating expenses was primarily due to an increase in sales, general and administrative expenses as well as stock-based compensation, as follows:
Sales, General and Administrative Expenses
Our Sales, General and Administrative Expenses for the three months ended March 31, 2023, were $7,769,314, an increase of $3,082,988, or 66%, from $4,686,326 for the three months ended March 31, 2022. This increase in sales, general and administrative expenses was primarily due to greater marketing, customer acquisition and retention spend as well as increased payroll costs and stock compensation expense. More specifically:
| ● | Our payroll costs for the three months ended March 31, 2023, were $3,579,541, an increase of $1,452,242 or 68% from $2,127,299 for the three months ended March 31, 2022, primarily due to increased headcount and the implementation of a corporate bonus program. |
| ● | Our marketing costs for the three months ended March 31, 2023, were $2,728,993, an increase of $1,357,974 or 99% from $1,371,019 for the three months ended March 31, 2022, primarily due to increased advertising spend to increase the market for our Loop Players, the rewards program for our customers and securing affiliate partnerships aimed at the distribution and activation of Loop Players partially offset by a reduction in digital and special audience spend. |
34
| ● | Our professional fees for the three months ended March 31, 2023, were $377,913, a decrease of $47,745 or 11% from $425,658 for the three months ended March 31, 2022. |
| ● | Our administration fees for the three months ended March 31, 2023, were $354,419, an increase of $296,078 or 507% from $58,341 for the three months ended March 31, 2022, primarily due to an increase in insurance premiums and board fees. |
Stock-Based Compensation
Our stock compensation (non-cash) for the three months ended March 31, 2023, was $2,475,807, an increase of $1,302,702 or 111% from $1,173,106 for the three months ended March 31, 2022, primarily due to the granting of stock option awards to existing and new employees as well as restricted stock units to the Board of Directors and Executive Officers since March 31, 2022, which resulted in additional expenses for the three months ended March 31, 2023.
Total Other Income (Expense)
Our other expenses for the three months ended March 31, 2023, were $922,068, an increase of $475,247 or 106% from $446,821 other income for the three months ended March 31, 2022. This increase in other expenses was primarily due to increased interest expense from rising interest rates and increased borrowing.
For the six months ended March 31, 2023, compared to the six months ended March 31, 2022:
Six months ended March 31, | ||||||||||||
| 2023 |
| 2022 |
| $ variance |
| % variance | |||||
Revenue |
| $ | 20,219,062 |
| $ | 7,875,873 |
| $ | 12,343,189 |
| 157 | % |
Cost of revenue |
| 12,947,950 |
| 4,960,194 |
| 7,987,756 |
| 161 | % | |||
Gross profit margin | 7,271,112 |
| 2,915,679 |
| 4,355,433 |
| 149 | % | ||||
Total operating expenses |
| 20,416,787 |
| 11,801,511 |
| 8,615,276 |
| 73 | % | |||
Loss from operations |
| (13,145,675) |
| (8,885,832) |
| (4,259,843) |
| 48 | % | |||
Other income (expense): |
|
|
|
|
|
|
|
| ||||
Interest income |
| — |
| 200 |
| (200) |
| (100) | % | |||
Interest expense |
| (1,927,027) |
| (998,506) |
| (928,521) |
| 93 | % | |||
Gain (Loss) on extinguishment of debt, net | — | 490,051 | (490,051) | (100) | % | |||||||
Change in fair value of derivatives | — | 146,313 | (146,313) | (100) | % | |||||||
Other income | (2,624) | — | (2,624) | N/A | % | |||||||
Total other income (expense) |
| (1,929,651) |
| (361,942) |
| (1,567,709) |
| 433 | % | |||
Provision for income taxes |
| (1,230) |
| (1,051) |
| (179) |
| 17 | % | |||
Net loss | $ | (15,076,556) |
| $ | (9,248,825) |
| $ | (5,827,731) |
| 63 | % | |
Revenue
Our revenue for the six months ended March 31, 2023, was $20,219,062, an increase of $12,343,189, or 157%, from $7,875,873 for the six months ended March 31, 2022. This increase was primarily driven by significantly more Loop Players deployed into the market, as well as the benefit from our Partner Platform business that was launched in May 2022.
Cost of Revenue
Our cost of revenue for the six months ended March 31, 2023, was $12,947,950, an increase of $7,987,756, or 161%, from $4,960,194 for the six months ended March 31, 2022. This increase in cost of revenue was primarily due to increased royalties and license fees associated with higher business activities and revenue share arrangements with the
35
Music Labels and content providers. In addition, our network infrastructure and server hosting costs rose primarily due to the expansion of our business and customers using our service.
Gross Profit Margin
Our gross profit margin for the six months ended March 31, 2023, was $7,271,112, an increase of $4,355,433, or 149%, from $2,915,679 for the six months ended March 31, 2022. This increase in gross profit margin was primarily due to increased revenue as well as new contracts with reduced average content costs.
Our gross profit margin as a percentage of total revenue for the six months ended March 31, 2023, was approximately 36% compared to 37% for the six months ended March 31, 2022. The slight percentage decrease was primarily driven by revenue mix as the year-ago period did not include the launch of our Partner Platform business, which carries lower gross margin but higher operating margin.
The relative contributions to total revenue of our O&O Platform and Partner Platforms businesses will impact our gross profit margin as a percentage of total revenue in future periods, as each of those businesses have different cost of revenue components with a lower gross profit margin in our Partner Platforms business.
Total Operating Expenses
Our operating expenses for the six months ended March 31, 2023, were $20,416,787, an increase of $8,615,276, or 73%, from $11,801,511 for the six months ended March 31, 2022. This increase in operating expenses was primarily due to an increase in sales, general and administrative expenses as well as stock-based compensation, as follows:
Sales, General and Administrative Expenses
Our Sales, General and Administrative Expenses for the six months ended March 31, 2023, were $15,727,448, an increase of $6,713,251, or 74%, from $9,014,197 for the six months ended March 31, 2022. This increase in sales, general and administrative expenses was primarily due to greater marketing, customer acquisition and retention spend, increased payroll costs as well as higher public company costs related to our public offering and uplisting to the NYSE American. More specifically:
| ● | Our payroll costs for the six months ended March 31, 2023, were $6,766,588, an increase of $2,846,529 or 73% from $3,920,059 for the six months ended March 31, 2022, primarily due to increased headcount and the implementation of a corporate bonus program. |
| ● | Our marketing costs for the six months ended March 31, 2023, were $5,835,275, an increase of $3,399,464 or 140% from $2,435,811 for the six months ended March 31, 2022, primarily due to increased advertising spend to increase the market for our Loop Players, the rewards program for our customers and securing affiliate partnerships aimed at the distribution and activation of Loop Players partially offset by a reduction in digital and special audience spend. |
| ● | Our professional fees for the six months ended March 31, 2023, were $889,361, a decrease of $211,359 or 19% from $1,100,720 for the six months ended March 31, 2022. |
| ● | Our administration fees for the six months ended March 31, 2023, were $751,843, an increase of $597,304 or 387% from $154,539 for the six months ended March 31, 2022, primarily due to an increase in insurance premiums and board fees. |
36
Stock-Based Compensation
Our stock compensation (non-cash) for the six months ended March 31, 2023, was $4,266,614, an increase of $1,544,102 or 57% from $2,722,512 for the six months ended March 31, 2022, primarily due to the granting of stock option awards and RSUs to existing and new employees as well as restricted stock units to the Board of Directors and Executive Officers since March 31, 2022, which resulted in additional expenses for the six months ended March 31, 2023.
Sales, General and Administrative Expenses as a percentage of total revenue for the six months ended March 31, 2023, was approximately 77.8% compared to 114.5% for the six months ended March 31, 2022, a significant reduction as we continued to improve our operating leverage.
Total Other Income (Expense)
Our other expenses for the six months ended March 31, 2023, were $1,929,651, an increase of $1,567,709 or 433% from $361,942 other income for the six months ended March 31, 2022. This increase in other expenses was primarily due to increased interest expense from rising interest rates and increased borrowing.
Non-GAAP EBITDA
We believe that the presentation of EBITDA, a financial measure that is not part of U.S. Generally Accepted Accounting Principles, or U.S. GAAP, provides investors with additional information about our financial results. EBITDA is an important supplemental measure used by our Board of Directors and management to evaluate our operating performance from period-to-period on a consistent basis and as a measure for planning and forecasting overall expectations and for evaluating actual results against such expectations. We define EBITDA as earnings before interest expense (income), income tax (expense)/benefit, depreciation and amortization.
EBITDA is not measured in accordance with, or an alternative to, measures prepared in accordance with U.S. GAAP. In addition, this non-GAAP measure is not based on any comprehensive set of accounting rules or principles. As a non-GAAP measure, EBITDA has limitations in that it does not reflect all of the amounts associated with our results of operations as determined in accordance with U.S. GAAP. In particular:
| ● | EBITDA does not reflect the amounts we paid in interest expense on our outstanding debt; |
| ● | EBITDA does not reflect the amounts we received in interest income on our investments; |
| ● | EBITDA does not reflect the amounts we paid in taxes or other components of our tax provision; |
| ● | EBITDA does not include depreciation expense from fixed assets; and |
| ● | EBITDA does not include amortization expense. |
Because of these limitations, you should consider EBITDA alongside other financial performance measures including net income (loss) and our financial results presented in accordance with U.S. GAAP.
37
The following table provides a reconciliation of net loss to EBITDA for each of the periods indicated:
| Three months ended March 31, | Six months ended March 31, | ||||||||||
2023 |
| 2022 | 2023 |
| 2022 | |||||||
GAAP net loss | $ | (9,817,117) | $ | (4,974,830) | $ | (15,076,556) | $ | (9,248,825) | ||||
Adjustments to reconcile to EBITDA: |
|
|
|
|
|
|
|
| ||||
Interest expense |
| 919,444 |
| 494,389 |
| 1,927,027 |
| 998,506 | ||||
Interest income |
| — |
| — |
| — |
| (200) | ||||
Depreciation and amortization expense* |
| 865,552 | 378,557 | 1,735,435 | 722,015 | |||||||
Income Tax expense/(benefit) |
| — |
| 800 |
| 1,230 |
| 1,051 | ||||
EBITDA | $ | (8,032,121) | $ | (4,101,084) | $ | (11,412,864) | $ | (7,527,453) | ||||
*Includes amortization of content assets for cost of revenue and operating expenses.
Non-GAAP Adjusted EBITDA
We believe that the presentation of Adjusted EBITDA, a financial measure that is not part of U.S. Generally Accepted Accounting Principles, or U.S. GAAP, provides investors with additional information about our financial results. Adjusted EBITDA is an important supplemental measure used by our Board of Directors and management to evaluate our operating performance from period-to-period on a consistent basis and as a measure for planning and forecasting overall expectations and for evaluating actual results against such expectations.
We define Adjusted EBITDA as earnings before interest expense (income), income tax (expense)/benefit, depreciation and amortization, adjusted for stock-based compensation and non-recurring income and expenses, if any.
Adjusted EBITDA is not measured in accordance with, or an alternative to, measures prepared in accordance with U.S. GAAP. In addition, this non-GAAP measure is not based on any comprehensive set of accounting rules or principles. As a non-GAAP measure, Adjusted EBITDA has limitations in that it does not reflect all of the amounts associated with our results of operations as determined in accordance with U.S. GAAP. In particular:
| ● | Adjusted EBITDA does not reflect the amounts we paid in interest expense on our outstanding debt; |
| ● | Adjusted EBITDA does not reflect the amounts we paid in taxes or other components of our tax provision; |
| ● | Adjusted EBITDA does not include depreciation expense from fixed assets; |
| ● | Adjusted EBITDA does not include amortization expense; |
| ● | Adjusted EBITDA does not include the impact of stock-based compensation; |
| ● | Adjusted EBITDA does not include the impact of the gain on extinguishment of debt; |
| ● | Adjusted EBITDA does not include the impact of the change in fair value of derivative. |
Because of these limitations, you should consider Adjusted EBITDA alongside other financial performance measures including net income (loss) and our financial results presented in accordance with U.S. GAAP.
38
The following table provides a reconciliation of net loss to Adjusted EBITDA for each of the periods indicated:
| Three months ended March 31, | Six months ended March 31, | ||||||||||
2023 |
| 2022 | 2023 |
| 2022 | |||||||
GAAP net loss | $ | (9,817,117) | $ | (4,974,830) | $ | (15,076,556) | $ | (9,248,825) | ||||
Adjustments to reconcile to Adjusted EBITDA: |
|
|
|
|
|
| ||||||
Interest expense |
| 919,444 |
| 494,389 |
| 1,927,027 |
| 998,506 | ||||
Interest income |
| — |
| — |
| — |
| (200) | ||||
Depreciation and amortization expense * |
| 865,552 |
| 378,557 |
| 1,735,435 |
| 722,015 | ||||
Income tax expense (benefit) |
| — |
| 800 |
| 1,230 |
| 1,051 | ||||
Stock-based compensation** |
| 2,475,807 |
| 1,173,106 |
| 4,266,614 |
| 2,722,512 | ||||
Gain on extinguishment of debt | — | — | — | (490,051) | ||||||||
Change in fair value of derivative | — | (47,568) | — | (146,313) | ||||||||
Adjusted EBITDA | $ | (5,556,314) | $ | (2,975,546) | $ | (7,146,250) | $ | (5,441,305) | ||||
* Includes amortization of content assets for cost of revenue and operating expenses.
** Includes options, restricted stock units (“RSUs”) and warrants.
Liquidity and Capital Resources
As of March 31, 2023, we had cash of $4.7 million. The following table provides a summary of our net cash flows from operating, investing, and financing activities.
Six months ended March 31, | ||||||
| 2023 |
| 2022 | |||
Net cash used in operating activities | $ | (8,715,387) | $ | (5,598,220) | ||
Net cash used in investing activities |
| (1,046,876) |
| — | ||
Net cash provided by (used in) financing activities |
| 341,112 |
| 2,073,670 | ||
Change in cash |
| (9,421,151) |
| (3,524,550) | ||
Cash, beginning of period |
| 14,071,914 |
| 4,162,548 | ||
Cash, end of period | $ | 4,650,763 | $ | 637,998 | ||
Cash Flows for the Six Months Ended March 31, 2023, and 2022
Net Cash Flow Used in Operating Activities
Our net cash used in operating activities during the six months ended March 31, 2023, was $8,715,387, an increase of $3,117,167, or 56%, from $5,598,220 for the six months ended March 31, 2022. This increase in net cash used in the six months ended March 31, 2023, was primarily due to the net loss of $15,076,556 and a net decrease in operating assets and liabilities of $944,720, offset by stock-based compensation expense of $4,266,614, amortization of content assets of $1,312,710, amortization of debt discount of $1,244,329, depreciation and amortization expense of $422,725 and amortization of right-of-use assets of $59,511.
Our net cash used in operating activities for the six months ended March 31, 2022, was $5,598,220 primarily due to the net loss of $9,248,825, a gain on extinguishment of debt of $490,051 and a change in fair value of derivatives of $146,313, a net decrease in operating assets and liabilities of $57,369 offset by stock-based compensation expense of $2,722,512, amortization of debt discount of $713,197, amortization of content assets of $657,213, payment in kind for interest stock issuance of $88,500, amortization of right-of-use assets of $78,114, depreciation and amortization of $64,802 and a write-off for bad debt expense of $20,000.
39
Net Cash Flow Used in Investing Activities
Our net cash used in investing activities during the six months ended March 31, 2023, was $1,046,876, primarily due to the purchase of property and equipment of $1,046,876 compared to $0 for the six months ended March 31, 2022.
Net Cash Flow Provided by Financing Activities
Our net cash provided by financing activities during the six months ended March 31, 2023, was $341,112, a decrease of $1,732,558 or 84% from $2,073,670 for the six months ended March 31, 2022, primarily due to proceeds from non-revolving line of credit of $28,087,249 and short swing profit recovery of $1,201, offset by payments on line of credit of $27,326,600, payment of acquisition-related consideration of $250,125, issuance costs related to the uplist of our stock on the NYSE American of $86,330, deferred offering costs of $61,983, and debt issuance costs of $22,300.
Our net cash provided by financing activities for the six months ended March 31, 2022, was $2,073,670 primarily due to receipt of proceeds from credit facility of $1,500,000, proceeds from the issuance of common stock of $1,250,000, offset by the repayment on loans of $552,832 and deferred offering costs of $123,498.
As a result of the above activities, we recorded a net decrease in cash of $9,421,151 for the six months ended March 31, 2023. We reported a cash balance of $4,650,763 as of March 31, 2023.
Future Capital Requirements
We have generated limited revenue, and as of March 31, 2023, our cash totaled $4,650,763, and we had an accumulated deficit of $111,398,420. We believe that our existing cash will enable us to fund our operations for at least twelve months from the date of this Report. We have based this estimate on assumptions that may prove to be wrong, and we could use our available capital resources sooner than we expect. We anticipate that we will continue to incur net losses for the foreseeable future; however, changing circumstances may cause us to expend cash significantly faster than we currently anticipate, and we may need to spend more cash than currently expected because of circumstances beyond our control.
Historically, our principal sources of cash have included proceeds from the issuance of common stock, preferred stock and warrants and proceeds from the issuance of debt. Our principal uses of cash have included cash used in operations, payments for license rights and payments relating to purchases of property and equipment. We expect that the principal uses of cash in the future will be for continuing operations, and general working capital requirements. We expect that as our operations continue to grow, we will need to raise additional capital to sustain operations and growth.
Non-Revolving Lines of Credit
On February 23, 2022, we entered into a Non-Revolving Line of Credit Loan Agreement (the “Prior Excel Loan Agreement”) with Excel Family Partnership, LLLP (“Excel”), an entity managed by Bruce Cassidy, Chairman of our Board of Directors, for aggregate principal amount of $1,500,000, which was amended on April 13, 2022, to increase the aggregate principal amount to $2,000,000 (the “$2m Loan”). Effective as of April 25, 2022, we entered into a Non-Revolving Line of Credit Loan Agreement with Excel (the “Excel Non-Revolving Loan Agreement”) for an aggregate principal amount of $4,022,986 (the “Excel Non-Revolving Loan”). The Excel Non-Revolving Loan matures eighteen (18) months from the date of the Excel Non-Revolving Loan Agreement and accrues interest, payable semi-annually in arrears, at a fixed rate of interest equal to twelve (12) percent per year. On April 25, 2022, we used $2,000,000 of the proceeds of the Excel Non-Revolving Loan to prepay all of the remaining outstanding principal and interest of the $2m Loan and the Prior Excel Loan Agreement was terminated in connection with such prepayment. Under the Excel Non-Revolving Loan Agreement, we granted to the lender a security interest in all of our present and future assets and properties, real or personal, tangible or intangible, wherever located, including products and proceeds thereof (which was subsequently subordinated in connection with our Revolving Loan Agreement (as defined below). In connection with the Excel Non-Revolving Loan, on April 25, 2022, we issued a warrant for an aggregate of up to 383,141 shares of our common stock. The warrant has an exercise price of $5.25 per share, expires on April 25, 2025, and shall be exercisable at any time prior to the expiration date. Effective as of December 14, 2022, we entered into a Non-Revolving Line of Credit Agreement
40
Amendment and a Non-Revolving line of Credit Promissory Note Amendment with Excel to extend the maturity date of the Excel Non-Revolving Loan from eighteen (18) months to twenty-four (24) months from the date of the Excel Non-Revolving Loan. Effective as of May 10, 2023, we entered into a Non-Revolving Line of Credit Agreement Amendment No, 2 and a Non-Revolving Line of Credit Promissory Note Amendment No. 2 with Excel to extend the maturity date of the Excel Non-Revolving Loan from twenty-four (24) months to twenty-five (25) months from the date of the Excel Non-Revolving Loan.
The Excel Non-Revolving Loan had a balance, including accrued interest, amounting to $4,232,181 and $4,226,181 as of March 31, 2023, and September 30, 2022, respectively. We incurred interest expense for the Excel Non-Revolving Loan in the amount of $755,719 and $0 for the six months ended March 31, 2023, and 2022.
Effective as of May 13, 2022, we entered into a Non-Revolving Line of Credit Loan Agreement (the “RAT Non-Revolving Loan Agreement”) with several institutions and individuals and RAT Investment Holdings, LP, as administrator of the loan (the “Loan Administrator”) for an aggregate principal amount of $2,200,000 (the “RAT Non-Revolving Loan”). The RAT Non-Revolving Loan matures eighteen (18) months from the effective date of the RAT Non-Revolving Loan Agreement and accrues interest, payable semi-annually in arrears, at a fixed rate of interest equal to twelve (12) percent per year. Under the RAT Non-Revolving Loan Agreement, we granted to the lenders under the RAT Non-Revolving Loan Agreement a security interest in all of our present and future assets and properties, real or personal, tangible or intangible, wherever located, including products and proceeds thereof, which security interest is pari passu with the Excel Non-Revolving Loan Agreement (which was subsequently subordinated in connection with our Revolving Loan Agreement). In connection with the RAT Non-Revolving Loan Agreement, on May 13, 2022, we issued a warrant (each a “Warrant” and collectively, the “Warrants”) to each lender under the RAT Non-Revolving Loan Agreement for an aggregate of up to 209,522 shares of our common stock (the “Warrant Shares”). Each Warrant has an exercise price of $5.25 per share, expires on May 13, 2025, and shall be exercisable at any time prior to the expiration date.
The RAT Non-Revolving Loan had a balance, including accrued interest, amounting to $2,300,537 and $2,301,260 as of March 31, 2023, and September 30, 2022, respectively. We incurred interest expense for the RAT Non-Revolving Loan in the amount of $446,764 and $0 for the six months ended March 31, 2023, and 2022.
Revolving Loan Agreement
Effective as of July 29, 2022, we entered into a Loan and Security Agreement (the “Revolving Loan Agreement”) with Industrial Funding Group, Inc. (the “Initial Lender”) for a revolving loan credit facility for the initial principal sum of up to $4,000,000, and through the exercise of an accordion feature, a total sum of up to $10,000,000, evidenced by a Revolving Loan Secured Promissory Note, also effective as of July 29, 2022 (the “Revolving Loan”). Shortly after the effective date of the Revolving Loan, the Initial Lender assigned the Revolving Loan Agreement, and the loan documents related thereto, to GemCap Solutions, LLC (the “Senior Lender” or “GemCap”). Availability for borrowing under the Revolving Loan Agreement is dependent upon our assets in certain eligible accounts and measures of revenue, subject to reduction for reserves that the Senior Lender may require in its discretion, and the accordion feature is a provision whereby we may request that the Senior Lender increase availability under the Revolving Loan Agreement, subject to its sole discretion. Effective as of October 27, 2022, we entered into Amendment Number 1 to the Loan and Security Agreement and to the Loan Agreement Schedule with the Senior Lender to increase the principal sum available under the Revolving Loan Agreement from $4,000,000 to $6,000,000. As of March 31, 2023, we had borrowed $5,304,209 under the Revolving Loan. The Revolving Loan matures on July 29, 2024, and began accruing interest on the unpaid principal balance of advances, payable monthly in arrears, on September 7, 2022, at an annual rate equal to the greater of (I) the sum of (i) the “Prime Rate” as reported in the “Money Rates” column of The Wall Street Journal, adjusted as and when such Prime Rate changes, plus (ii) zero percent (0.00%), and (II) four percent (4.00%). Under the Revolving Loan Agreement, we have granted to the Senior Lender a first-priority security interest in all of our present and future property and assets, including products and proceeds thereof. In connection with the loan, our existing secured lenders (the “Subordinated Lenders”) delivered subordination agreements (the “Subordination Agreements”) to the Senior Lender. We are permitted to make regularly scheduled payments, including payments upon maturity, to such subordinated lenders and potentially other payments subject to a measure of cash flow and receiving certain financing activity proceeds, in accordance with the terms of the Subordination Agreements. In connection with the delivery of the Subordination Agreements by the Subordinated Lenders, on July 29, 2022, we issued warrants to each Subordinated Lender on identical terms for an aggregate of up to
41
296,329 shares of our common stock. Each warrant has an exercise price of $5.25 per share, expires on July 29, 2025 (the “Expiration Date”), and shall be exercisable at any time prior to the Expiration Date. One warrant for 191,570 warrant shares was issued to Eagle Investment Group, LLC, an entity managed by Bruce Cassidy, Chairman of our Board of Directors, as directed by its affiliate, Excel Family Partners, LLLP, one of the Subordinated Lenders. The Subordinated Lenders receiving warrants for the remaining 104,759 warrant shares was also entitled to receive a cash payment of $22,000 six months from the date of the Subordination Agreements, representing one percent (1.00%) of the outstanding principal amount of the loan held by such Subordinated Lenders. This cash payment was made to those Subordinated Lenders on January 25, 2023.
The Revolving Loan had a balance, including accrued interest, amounting to $5,350,214 and $4,587,255 as of March 31, 2023, and September 30, 2022, respectively. We incurred interest expense for the Revolving Loan in the amount of $714,740 and $0 for the six months ended March 31, 2023, and 2022.
2023 Secured Loan
Effective as of May 10, 2023, we entered into a Secured Non-Revolving Line of Credit Loan Agreement (the “2023 Secured Loan Agreement”) with several individual and institutional lenders (each individually a “Lender” and collectively, the “Lenders”) for aggregate loans of up to $4.0 million (the “2023 Secured Loan”), by Secured Non-Revolving Line of Credit Promissory Notes (each a “2023 Secured Note” and collectively, the “2023 Secured Notes”), also effective as of May 10, 2023. The 2023 Secured Loan matures twenty-four (24) months from the date of the 2023 Secured Loan Agreement and accrues interest, payable semi-annually in arrears, at a fixed rate of interest equal to twelve (12) percent per year.
In connection with the 2023 Secured Loan, on May 10, 2023, we issued warrants (the “Warrants”) to purchase up to an aggregate of 369,517 shares of our common stock (the “Warrant Shares”) to the Lenders. The Warrants have an exercise price of $4.33 per share, expires on May 10, 2026 (the “Expiration Date”), and shall be exercisable at any time prior to the Expiration Date.
Under the 2023 Secured Loan Agreement, we have granted to the Lenders a security interest in all of our present and future assets and properties, real or personal, tangible or intangible, wherever located, including products and proceeds thereof. In connection with the 2023 Secured Loan Agreement, the Lenders delivered subordination agreements (the “Subordination Agreements”) to GemCap Solutions, LLC, as successor and assign to Industrial Funding Group, Inc.(the “Senior Lender” or “GemCap”), pursuant to which our obligations to the Lenders and the indebtedness under the 2023 Secured Loan Agreement are subordinate and junior in right of payment to the indebtedness under our account receivable facility evidenced by that certain Loan and Security Agreement dated as of July 29, 2022, with the Senior Lender.
Excel Family Partners, LLLP (“Excel”), an entity managed by Bruce Cassidy, Chairman of our Board of Directors, is a Lender under the 2023 Secured Loan Agreement for an aggregate loan of $2.65 million. In connection with such loan, we issued a Warrant for 244,804 Warrant Shares to Excel.
The issuance of the Warrants was not registered under the Securities Act of 1933, as amended (the “Securities Act”). The Warrants were issued in a private placement exempt from the registration requirements of the Securities Act, in reliance on the exemptions set forth in Section 4(a)(2) of the Securities Act.
The descriptions of the Loan Agreement, the Notes, the Subordination Agreements and the Warrants are summaries and are qualified in their entirety by reference to the full texts of the Loan Agreement, the form of Note, the form of Subordination Agreement and the form of Warrant.
42
Shelf Registration ($50 Million ATM)
We have filed a shelf Registration Statement on Form S-3 that has been declared effective by the Securities and Exchange Commission. On May 12, 2023, we entered into an At Market Issuance Sales Agreement (the “Sales Agreement”) with B. Riley Securities, Inc. (the “Agent”) pursuant to which we may offer and sell, from time to time through the Agent, shares of our common stock, par value $0.0001 per share (“Common Stock”), for aggregate gross proceeds of up to $50,000,000. Since May 12, 2023, we have not had any sales under the Sales Agreement.
Our future use of operating cash and capital requirements will depend on many forward-looking factors, including the following:
| ● | our ability to attract and retain management with experience in digital media including digital video music streaming, and similar emerging technologies; |
| ● | our ability to negotiate, finalize and maintain economically feasible agreements with the major and independent music labels, publishers and performance rights organizations; |
| ● | our expectations regarding market acceptance of our products in general, and our ability to penetrate digital video music streaming in particular; |
| ● | volatility in digital programmatic advertising spend which can affect our revenues; |
| ● | the scope, validity and enforceability of our and third-party intellectual property rights; |
| ● | the intensity of competition; |
| ● | the effects of the ongoing pandemic caused by the spread of COVID-19 and our business clients ability to service their clients’ in out of home venues that have limited their public capacity; |
| ● | changes in the political and regulatory environment and in business and fiscal conditions in the United States and overseas; |
| ● | our ability to attract prospective users and to retain existing users; |
| ● | our dependence upon third-party licenses for sound recordings and musical compositions; |
| ● | our lack of control over the providers of our content and their effect on our access to music and other content; |
| ● | our ability to comply with the many complex license agreements to which we are a party; |
| ● | our ability to accurately estimate the amounts payable under our license agreements; |
| ● | the limitations on our operating flexibility due to the minimum guarantees required under certain of our license agreements; |
| ● | our ability to obtain accurate and comprehensive information about music compositions in order to obtain necessary licenses or perform obligations under our existing license agreements; |
| ● | potential breaches of our security systems; |
| ● | assertions by third parties of infringement or other violations by us of their intellectual property rights; |
43
| ● | our ability to generate sufficient revenue to be profitable or to generate positive cash flow on a sustained basis; |
| ● | our ability to accurately estimate our user metrics; |
| ● | risks associated with manipulation of stream counts and user accounts and unauthorized access to our services; |
| ● | our ability to maintain, protect and enhance our brand; |
| ● | risks relating to the acquisition, investment and disposition of companies or technologies; |
| ● | dilution resulting from additional share issuances; |
| ● | tax-related risks; |
| ● | the concentration of voting power among our founders who have and will continue to have substantial control over our business; and |
| ● | risks associated with accounting estimates, currency fluctuations and foreign exchange controls. |
We have evaluated and expect to continue to evaluate a wide array of strategic transactions as part of our plan to acquire or license and develop additional products and services to augment our current business operations. Strategic transaction opportunities that we may pursue could materially affect our liquidity and capital resources and may require us to incur additional indebtedness, seek equity capital or both. Accordingly, we expect to continue to opportunistically seek access to additional capital to license or acquire additional products, services or companies to expand our operations, or for general corporate purposes. Strategic transactions may require us to raise additional capital through one or more public or private debt or equity financings or could be structured as a collaboration or partnering arrangement. We have no arrangements, agreements, or understandings in place at the present time to enter into any acquisition, licensing or similar strategic business transaction.
If we raise additional funds by issuing equity securities, our stockholders will experience dilution. Debt financing, if available, would result in increased fixed payment obligations and may involve agreements that include covenants limiting or restricting our ability to take specific actions, such as incurring additional debt, making capital expenditures, or declaring dividends. Any debt financing or additional equity that we raise may contain terms, such as liquidation and other preferences that are not favorable to us or our stockholder.
As of March 31, 2023, our cash totaled $4,650,763. During the six months ended March 31, 2023, we incurred a net loss of $15,076,556 and used $8,156,938 of cash in operations. We have incurred significant operating losses in the past and, as of March 31, 2023, we had an accumulated deficit of approximately $111,398,420. We do not expect to experience positive cash flows from operations in the near future as we continue to invest in the distribution of our Loop Players and the expansion of our Partner Platform business. We also expect to incur significant additional legal and financial expenditures in meeting the regulatory requirements of an NYSE-American listed public company.
There is uncertainty regarding our ability to grow our business without additional financing. Our long-term future growth and success are dependent upon our ability to continue selling our services, generate cash from operating activities and obtain additional financing. We may be unable to continue selling our products and services, generate sufficient cash from operations, sell additional shares of common stock or borrow additional funds. Our inability to obtain additional cash could have a material adverse effect on our ability to grow our business to a greater extent than we can with our existing financial resources.
44
Based on our current operating plan, we believe that our existing cash will enable us to fund our operations for at least the twelve months from the date of this Report. We have based this estimate on assumptions that may prove to be wrong, and we could use our available capital resources sooner than we expect.
Critical Accounting Policies and Use of Estimates
Use of Estimates and Assumptions
The preparation of the financial statements in conformity with generally accepted accounting principles requires management to make estimates and assumptions that affect the reported amounts of assets and liabilities and disclosure of contingent assets and liabilities at the date of the financial statements and the reported amounts of revenue and expenses during the reporting period. Actual results could differ from those estimates. Significant estimates include assumptions used in the revenue recognition of performance obligations, fair value of stock-based compensation awards and income taxes.
Revenue Recognition
Our revenue recognition disclosure reflects our updated accounting policies that are affected by this new standard. We applied the “modified retrospective” transition method for open contracts for the implementation of Topic 606. As sales are and have been primarily from delivery of streaming services, delivery of subscription content services in customized formats, and delivery of hardware and ongoing content delivery through software and we have no significant post-delivery obligations, this new standard did not result in a material recognition of revenue on our consolidated financial statements for the cumulative impact of applying this new standard. Therefore, there was no cumulative effect adjustment required.
We recognize revenue when it satisfies a performance obligation by transferring control over a product to a customer. Revenue is measured based on the consideration we expect to receive in exchange for those products. In instances where final acceptance of the product is specified by the customer, revenue is deferred until all acceptance criteria have been met. For example, we bill subscription services in advance of when the service is performed and revenue is treated as deferred revenue until the service is performed and/or the performance obligation is satisfied. Revenues are recognized under Topic 606 in a manner that reasonably reflects the delivery of our products and services to clients in return for expected consideration and includes the following elements:
| ● | executed contracts with our clients that we believe are legally enforceable; |
| ● | identification of performance obligations in the respective contract; |
| ● | determination of the transaction price for each performance obligation in the respective contract; |
| ● | allocation the transaction price to each performance obligation; and |
| ● | recognition of revenue only when we satisfy each performance obligation. |
45
Performance Obligations and Significant Judgments
Our revenue can be categorized into two revenue streams: Advertising revenue and Legacy and other revenue.
The following table disaggregates our revenue by major type for the three and six months ended March 31, 2023, and 2022.
Three months ended March 31, | Six months ended March 31, | |||||||||||
2023 | 2022 | 2023 | 2022 | |||||||||
Advertising revenue | $ | 4,648,390 | $ | 3,499,791 | $ | 18,607,895 | $ | 4,936,878 | ||||
Legacy and other revenue | 744,841 | 1,380,048 | 1,611,167 | 2,938,995 | ||||||||
Total | $ | 5,393,231 | $ | 4,879,839 | $ | 20,219,062 | $ | 7,875,873 | ||||
Our performance obligations and recognition patterns for each revenue stream are as follows:
Advertising Revenue
For the three and six months ended March 31, 2023, advertising revenue accounts for 86% and 92%, respectively, of our revenue and includes revenue from direct and programmatic advertising as well as sponsorships.
For all advertising revenue sources, we evaluate whether we should be considered the principal (i.e., report revenues on a gross basis) or an agent (i.e., report revenues on a net basis). Our role as principal or agent differs based on our performance obligation for each revenue share arrangement.
For both the O&O and Platform Partner businesses, advertising inventory provided to advertisers through the use of an advertising demand partner or agency, with whose fees or commission is calculated based on a stated percentage of gross advertising spending, we are considered the agent and our revenues are reported net of agency fees and commissions. We are considered the agent because the demand partner or agency controls all aspects of the transaction (pricing risk, inventory risk, obligation for fulfillment) except for the devices used to show the advertisements, therefore we report this advertising revenue net of agency fees and commissions.
We are considered the principal in our arrangements with content providers in our O&O Platform business and with our arrangements with our third-party partners in our Partner Platforms business and thus report revenues on a gross basis (net of agency fees and commissions), wherein the amounts billed to our advertising demand partners, advertising agencies, and direct advertisers and sponsors are recorded as revenues, and amounts paid to content providers and third-party partners are recorded as expenses. We are considered the principal because we control the advertising space, are primarily responsible to our advertising demand partners and other parties filling our advertising inventory, have discretion in pricing and advertising fill rates and typically have an inventory risk.
For advertising revenue, we recognize revenue at the time the digital advertising impressions are filled and the advertisements are played and, for sponsorship revenue, we generally recognize revenue ratably over the term of the sponsorship arrangement as the sponsored advertisements are played.
Legacy and Other Business Revenue
For the three and six months ended March 31, 2023, legacy and other business revenue accounts for the remaining 14% and 8%, respectively, of total revenue and includes streaming services, subscription content services, and hardware delivery, as described below:
| o | Delivery of streaming services including content encoding and hosting. We recognize revenue over the term of the service based on bandwidth usage. Revenue from streaming services is insignificant. |
46
| o | Delivery of subscription content services in customized formats. We recognize revenue straight-line over the term of the service. |
| o | Delivery of hardware for ongoing subscription content delivery through software. We recognize revenue at the point of hardware delivery. Revenue from hardware sales is insignificant. |
Transaction prices for performance obligations are explicitly outlined in relevant contractual agreements; therefore, we do not believe that significant judgments are required with respect to the determination of the transaction price, including any variable consideration identified.
Stock-Based Compensation
Stock-based compensation awarded to employees is measured at the award date, based on the fair value of the award, and is recognized as an expense over the requisite vesting period. We measure the fair value of the stock-based compensation issued to non-employees using the stock price observed in the trading market (for stock transactions) or the fair value of the award (for non-stock transactions), which were more reliably determinable measures of fair value than the value of the services being rendered. The measurement date is the earlier of (1) the date at which commitment for performance by the counterparty to earn the equity instruments is reached, or (2) the date at which the counterparty’s performance is complete.
Content Assets
On January 1, 2020, we adopted the guidance in ASU 2019-02, Entertainment—Films—Other Assets—Film Costs (Subtopic 926-20) and Entertainment—Broadcasters—Intangibles—Goodwill and Other (Subtopic 920-350): Improvements to Accounting for Costs of Films and License Agreements for Program Materials, on a prospective basis. We capitalize the fixed content fees and our corresponding liability when the license period begins, the cost of the content is known, and the content is accepted and available for streaming. If the licensing fee is not determinable or reasonably estimable, no asset or liability is recorded, and licensing costs are expenses as incurred. We amortize licensed content assets into cost of revenue, using the straight-line method over the contractual period of availability. The liability is paid in accordance with the contractual terms of the arrangement. Internally-developed content costs are capitalized in the same manner as licensed content costs, when the cost of the content is known and the content is ready and available for streaming. We amortize internally-developed content assets into cost of revenue, using the straight-line method over the estimated period of streaming.
Income Taxes
We account for income taxes in accordance with ASC Topic 740, Income Taxes. ASC 740 requires a company to use the asset and liability method of accounting for income taxes, whereby deferred tax assets are recognized for deductible temporary differences, and deferred tax liabilities are recognized for taxable temporary differences. Temporary differences are the differences between the reported amounts of assets and liabilities and their tax bases. Deferred tax assets are reduced by a valuation allowance when, in the opinion of management, it is more likely than not that some portion, or all of, the deferred tax assets will not be realized. Deferred tax assets and liabilities are adjusted for the effect of changes in tax laws and rates on the date of enactment.
Under ASC 740, a tax position is recognized as a benefit only if it is “more likely than not” that the tax position would be sustained in a tax examination, with a tax examination being presumed to occur. The amount recognized is the largest amount of tax benefit that is greater than 50% likely of being realized on examination. For tax positions not meeting the “more likely than not” test, no tax benefit is recorded. We have no material uncertain tax positions for any of the reporting periods presented.
We recognize accrued interest and penalties related to unrecognized tax benefits as part of income tax expense. We have also made a policy election to treat the income tax with respect to global intangible low-tax income as a period expense when incurred.
47
In December 2019, the FASB issued ASU No. 2019-12, Simplifying the Accounting for Income Taxes, as part of its initiative to reduce complexity in accounting standards. The amendments in the ASU are effective for fiscal years beginning after December 15, 2020, including interim periods therein. The adoption of this standard in the first quarter of 2022 had no impact on our consolidated financial statements.
Recently Adopted Accounting Pronouncements
In August 2020, the FASB issued ASU 2020-06, Debt – Debt with Conversion and Other Options (Subtopic 470-20) and Derivatives and Hedging – Contracts in Entity’s Own Equity (Subtopic 815-40). This ASU reduces the number of accounting models for convertible debt instruments and convertible preferred stock. As well as amend the guidance for the derivatives scope exception for contracts in an entity’s own equity to reduce form-over-substance-based accounting conclusions. In addition, this ASU improves and amends the related EPS guidance. The ASU is effective for interim and annual periods beginning after December 15, 2021, with early adoption permitted for periods beginning after December 15, 2020. Adoption of the ASU can either be on a modified retrospective or full retrospective basis. We adopted this ASU as of October 1, 2022, and there is no material impact as of March 31, 2023.
Item 3.Quantitative and Qualitative Disclosures About Market Risk.
Not required.
Item 4.Controls and Procedures.
Evaluation of Disclosure Controls and Procedures
We maintain disclosure controls and procedures, as defined in Rules 13a-15(e) and 15d-15(e) of the Exchange Act, consisting of controls and other procedures designed to give reasonable assurance that information we are required to disclose in the reports we file or submit under the Exchange Act is recorded, processed, summarized and reported within the time periods specified in the Securities and Exchange Commission’s rules and forms and that such information is accumulated and communicated to management, including our Chief Executive Officer and our Chief Financial Officer, to allow timely decisions regarding such required disclosure. Our Chief Executive Officer and Chief Financial Officer have evaluated such disclosure controls and procedures as of the end of the period covered by this quarterly Report on Form 10-Q and have determined that such disclosure controls and procedures are effective.
Changes in Internal Controls over Financial Reporting
There was no change in our internal control over financial reporting during the second quarter of 2023 that has materially affected, or is reasonably likely to materially affect, our internal control over financial reporting.
PART II — OTHER INFORMATION
Item 1.Legal Proceedings
We are currently not involved in any litigation that we believe could have a material adverse effect on our financial condition or results of operations. There is no action, suit, proceeding, inquiry or investigation before or by any court, public board, government agency, self-regulatory organization or body pending or, to the knowledge of our executive officers, threatened against or affecting us, or our common stock, in which an adverse decision could have a material adverse effect.
Item 1A. Risk Factors
There have been no material changes to the factors disclosed in Item 1A. Risk Factors in our Annual Report on Form 10-K for the year ended September 30, 2022.
48
Item 2.Unregistered Sales of Equity Securities and Use of Proceeds.
Not applicable.
Item 3.Defaults Upon Senior Securities.
There were no material defaults regarding payments of principal and interest that exceeded 5% of our total assets.
Item 4.Mine Safety Disclosures.
Not applicable.
Item 5.Other Information.
Debt Issuance
Effective as of May 10, 2023, we entered into a Secured Non-Revolving Line of Credit Loan Agreement (the “2023 Secured Loan Agreement”) with several individual and institutional lenders (each individually a “Lender” and collectively, the “Lenders”) for aggregate loans of up to $4.0 million (the “2023 Secured Loan”), by Secured Non-Revolving Line of Credit Promissory Notes (each a “2023 Secured Note” and collectively, the “2023 Secured Notes”), also effective as of May 10, 2023. The 2023 Secured Loan matures twenty-four (24) months from the date of the 2023 Secured Loan Agreement and accrues interest, payable semi-annually in arrears, at a fixed rate of interest equal to twelve (12) percent per year.
In connection with the 2023 Secured Loan, on May 10, 2023, we issued warrants (the “Warrants”) to purchase up to an aggregate of 369,517 shares of our common stock (the “Warrant Shares”) to the Lenders. The Warrants have an exercise price of $4.33 per share, expires on May 10, 2026 (the “Expiration Date”), and shall be exercisable at any time prior to the Expiration Date.
Under the 2023 Secured Loan Agreement, we have granted to the Lenders a security interest in all of our present and future assets and properties, real or personal, tangible or intangible, wherever located, including products and proceeds thereof. In connection with the 2023 Secured Loan Agreement, the Lenders delivered subordination agreements (the “Subordination Agreements”) to GemCap Solutions, LLC, as successor and assign to Industrial Funding Group, Inc.(the “Senior Lender” or “GemCap”), pursuant to which our obligations to the Lenders and the indebtedness under the 2023 Secured Loan Agreement are subordinate and junior in right of payment to the indebtedness under our account receivable facility evidenced by that certain Loan and Security Agreement dated as of July 29, 2022, with the Senior Lender.
Excel Family Partners, LLLP (“Excel”), an entity managed by Bruce Cassidy, Chairman of our Board of Directors, is a Lender under the 2023 Secured Loan Agreement for an aggregate loan of $2.65 million. In connection with such loan, we issued a Warrant for 244,804 Warrant Shares to Excel.
The issuance of the Warrants was not registered under the Securities Act of 1933, as amended (the “Securities Act”). The Warrants were issued in a private placement exempt from the registration requirements of the Securities Act, in reliance on the exemptions set forth in Section 4(a)(2) of the Securities Act.
The descriptions of the Loan Agreement, the Notes, the Subordination Agreements and the Warrants are summaries and are qualified in their entirety by reference to the full texts of the Loan Agreement, the form of Note, the form of Subordination Agreement and the form of Warrant.
Excel Non-Revolving Line of Credit Amendments
Effective as of May 10, 2023, we entered into a Non-Revolving Line of Credit Agreement Amendment No. 2 (the “Excel Line of Credit Amendment No. 2”) and a Non-Revolving Line of Credit Promissory Note Amendment No. 2
49
(the “Excel Note Amendment No. 2,” and together, the “Excel Non-Revolving Line of Credit Amendments”) with Excel to extend the maturity date of the Excel Non-Revolving Loan from twenty-four (24) months to twenty-five (25) months from the date of the Excel Non-Revolving Loan.
The descriptions of the Excel Non-Revolving Line of Credit Amendments are summaries and are qualified in their entirety by reference to the full texts of the Excel Line of Credit Amendment No. 2 and the Excel Note Amendment No. 2.
Shelf Registration ($50 Million ATM)
We have filed a shelf Registration Statement on Form S-3 that has been declared effective by the Securities and Exchange Commission. On May 12, 2023, we entered into an At Market Issuance Sales Agreement (the “Sales Agreement”) with B. Riley Securities, Inc. (the “Agent”) pursuant to which we may offer and sell, from time to time through the Agent, shares of our common stock, par value $0.0001 per share (“Common Stock”), for aggregate gross proceeds of up to $50,000,000. Since May 12, 2023, we have not had any sales under the Sales Agreement.
Item 6. Exhibits
Exhibit No. |
| Exhibit Description | ||
4.1 | ||||
10.1 | ||||
10.2 | Form of Secured Non-Revolving Line of Credit Promissory Note, effective as of May 10, 2023 | |||
10.3 | ||||
10.4 | ||||
10.5 | ||||
10.6 | ||||
31.1* |
| |||
|
|
| ||
31.2* |
| |||
|
|
| ||
32.1** |
| Certification of Chief Executive Officer pursuant to 18 U.S.C. Section 1350 | ||
|
|
| ||
32.2** |
| Certification of Chief Financial Officer pursuant to 18 U.S.C. Section 1350 | ||
101.INS | Inline XBRL Instance Document -the instance document does not appear in the Interactive Data File because its XBRL tags are embedded within the Inline XBRL document | |||
101.SCH | Inline XBRL Taxonomy Extension Schema | |||
101.CAL | Inline XBRL Taxonomy Extension Calculation Linkbase | |||
50
101.DEF | Inline XBRL Taxonomy Extension Definition Linkbase | |||
101.LAB | Inline XBRL Taxonomy Extension Label Linkbase | |||
101.PRE | Inline XBRL Taxonomy Extension Presentation Linkbase | |||
104 | Cover Page Interactive Data File (formatted as inline XBRL and contained in Exhibit 101) | |||
* Filed herewith.
** This certification is not deemed “filed” for purposes of Section 18 of the Securities Exchange Act of 1934, or otherwise subject to the liability of that section. Such certification will not be deemed to be incorporated by reference into any filing under the Securities Act of 1933 or the Securities Exchange Act of 1934, except to the extent that the registrant specifically incorporates it by reference.
51
Pursuant to the requirements of the Securities Act of 1934, the registrant has duly caused this report to be signed on its behalf by the undersigned thereunto duly authorized.
Loop Media, Inc., a Nevada corporation | ||
(Registrant) | ||
Date: May 12, 2023 | By: | /s/ Jon Niermann |
Jon Niermann | ||
Chief Executive Officer | ||
(Principal Executive Officer) | ||
Date: May 12, 2023 | By: | /s/ Neil Watanabe |
Neil Watanabe | ||
Chief Financial Officer | ||
(Principal Financial and Accounting Officer) | ||
52