UNITED STATES
SECURITIES AND EXCHANGE COMMISSION
Washington, D.C. 20549
FORM
For the quarterly period ended
OR
For the transition period from to
Commission File Number:
(Exact name of registrant as specified in its charter)
(State or other jurisdiction of incorporation) | (IRS Employer Identification Number) | |
| ||
(Address of principal executive offices) (Zip Code) | ||
( | ||
(Registrant’s telephone number, including area code) | ||
Securities registered pursuant to Section 12(b) of the Act: None
Indicate by check mark whether the registrant (1) has filed all reports required to be filed by Section 13 or 15(d) of the Securities Exchange Act of 1934 during the preceding 12 months (or for shorter period that the registrant was required to file such reports), and (2) has been subject to such filing requirements for the past 90 days. [X]
Indicate by check mark whether the registrant has submitted electronically every Interactive Data File required to be submitted pursuant to Rule 405 of Regulation S-T during the preceding 12 months (or for such shorter period that the registrant was required to submit such files). [X]
Indicate by check mark whether the registrant is a large accelerated filer, an accelerated filer, a non-accelerated filer, a smaller reporting company, or an emerging growth company. See the definitions of “large accelerated filer,” “accelerated filer,” “smaller reporting company,” and “emerging growth company” in Rule 12b-2 of the Exchange Act.
Large accelerated filer ☐ | Accelerated filer ☐ |
Smaller reporting company | |
Emerging growth company |
|
If an emerging growth company, indicate by check mark if the registrant has elected not to use the extended transition period for complying with any new or revised financial accounting standards provided pursuant to Section 13(a) of the Exchange Act. ☐Yes ☒
Indicate by check mark whether the registrant is a shell company (as defined in Rule 12b-2 of the Exchange Act).
As of February 14, 2022, the registrant had
TABLE OF CONTENTS
2 | ||
2 | ||
Management’s Discussion and Analysis of Financial Condition and Results of Operations. | 25 | |
35 | ||
35 | ||
36 | ||
36 | ||
37 | ||
Unregistered Sales of Equity Securities and Use of Proceeds. | 37 | |
37 | ||
37 | ||
37 | ||
37 | ||
39 | ||
1
PART I — FINANCIAL INFORMATION
Item 1Financial Statements.
LOOP MEDIA, INC. AND SUBSIDIARIES
CONDENSED CONSOLIDATED BALANCE SHEETS
December 31, |
| September 30, | |||
2021 | 2021 | ||||
ASSETS | (UNAUDITED) |
|
| ||
Current assets |
|
|
| ||
Cash | $ | | $ | | |
Accounts receivable, net |
| |
| | |
Inventory |
| |
| | |
Prepaid expenses and other current assets |
| |
| | |
Prepaid income tax |
| |
| | |
License content assets - current | | | |||
Total current assets |
| |
| | |
Non-current assets |
|
|
|
| |
Deposits |
| |
| | |
License content assets - non current | | | |||
Equipment, net |
| |
| | |
Operating lease right-of-use assets |
| |
| | |
Intangible assets, net |
| |
| | |
Goodwill |
| |
| | |
Total non-current assets |
| |
| | |
Total assets | $ | | $ | | |
LIABILITIES AND STOCKHOLDERS’ EQUITY |
|
|
| ||
Current liabilities |
|
|
|
| |
Accounts payable and accrued liabilities | $ | | $ | | |
Payable on acquisition |
| |
| | |
License content liabilities - current | | | |||
Note payable - current | — | | |||
Deferred Income |
| |
| | |
Convertible debt related party - current, net |
| |
| | |
Convertible debt – current, net |
| |
| — | |
Lease liability - current |
| |
| | |
Total current liabilities |
| |
| | |
Non-current liabilities |
|
|
|
| |
Convertible debt – related party, less current portion, net |
| |
| | |
Convertible debt, less current portion, net |
| — |
| | |
Note payable – non-current |
| — |
| | |
Derivative liability | | | |||
Lease liability |
| |
| | |
Total non-current liabilities |
| |
| | |
Total liabilities |
| |
| | |
Stockholders’ equity | |||||
Series B Convertible Preferred stock, $ | | | |||
Common Stock, $ |
| |
| | |
Additional paid in capital |
| |
| | |
Accumulated deficit |
| ( |
| ( | |
Total stockholders' equity |
| |
| | |
Total liabilities and stockholders' equity | $ | | $ | | |
See the accompanying notes to the consolidated financial statements
2
LOOP MEDIA, INC. AND SUBSIDIARIES
CONDENSED CONSOLIDATED STATEMENTS OF OPERATIONS
(UNAUDITED)
Three months ended December 31, | ||||||
| 2021 |
| 2020 | |||
Revenue | $ | | $ | | ||
Cost of revenue |
| |
| | ||
Gross profit |
| |
| | ||
Operating expenses |
|
|
|
| ||
Selling, general and administrative |
| |
| | ||
Impairment of goodwill and intangibles | — | | ||||
Total operating expenses |
| |
| | ||
Loss from operations |
| ( |
| ( | ||
Other income (expense) |
|
|
|
| ||
Interest income |
| |
| | ||
Interest expense |
| ( |
| ( | ||
Gain on extinguishment of debt, net | | | ||||
Loss on settlement of obligation | — | ( | ||||
Change in fair value of derivatives |
| |
| — | ||
Total other income (expense) |
| |
| ( | ||
Income tax (expense)/benefit |
| ( |
| ( | ||
Net loss | $ | ( | $ | ( | ||
|
| |||||
Net loss attributable to common stockholders | $ | ( | $ | ( | ||
Basic and diluted net loss per common share | ( | ( | ||||
Weighted average number of basic and diluted common shares outstanding | | | ||||
See the accompanying notes to the consolidated financial statements
3
LOOP MEDIA, INC. AND SUBSIDIARIES
CONDENSED CONSOLIDATED STATEMENT OF CHANGES IN STOCKHOLDERS’ EQUITY
FOR THE THREE MONTHS ENDED DECEMBER 31, 2021 and 2020
(UNAUDITED)
Preferred Stock Series B | Common Stock | Additional Paid | Accumulated | ||||||||||||||||
Shares | Amount | Shares | Amount | in Capital | Deficit | Total | |||||||||||||
Balances, September 30, 2021 |
| |
| $ | |
| |
| $ | |
| $ | |
| $ | ( |
| $ | |
Stock-based compensation | — | — | — | — | | — | | ||||||||||||
Net loss |
| — |
| — |
| — |
| — |
| — |
| ( | ( | ||||||
Balances, December 31, 2021 |
| | $ | |
| | $ | | $ | | $ | ( | $ | | |||||
Preferred Stock B | Preferred Stock A | Common Stock | Common stock | Additional Paid | Accumulated | |||||||||||||||||||||||
Shares | Amount | Shares | Amount | Shares | Amount | subscriptions | in Capital | Deficit | Total | |||||||||||||||||||
Balances, September 30, 2020 |
| |
| $ | | |
| $ | |
| |
| $ | |
| $ | |
| $ | |
| $ | ( | $ | | |||
Shares issued for cash |
|
| — |
| — | |
| |
| — |
| |
| — |
| | ||||||||||||
Cash received for common stock subscribed | — | — | — | — | | — | — | | ||||||||||||||||||||
Issuance of common stock subscribed | ( | ( | | ( | — | |||||||||||||||||||||||
Shares issued in connection with reverse merger |
| — | — | — | — | — | ( | — | ( | |||||||||||||||||||
Shares issued for asset purchase | — | — | | | — | | — | | ||||||||||||||||||||
Beneficial conversion feature of convertible debt | — | — | — | — | — | | — | | ||||||||||||||||||||
Stock-based compensation | — | — | — | — | — | | — | | ||||||||||||||||||||
Warrants issued to consultant | — | — | — | — | — | | — | | ||||||||||||||||||||
Shares issued for debt settlement | — | — | | | — | | — | | ||||||||||||||||||||
Shares issued for license content assets | | | | — | | |||||||||||||||||||||||
Shares issued for investment in unconsolidated entity | — | — | | | — | | — | | ||||||||||||||||||||
Net loss |
|
|
| — |
| — | — |
| — |
| — |
| — |
| ( |
| ( | |||||||||||
Balances, December 31, 2020 |
| $ | | $ | | | $ | | | $ | | $ | | $ | | $ | ( | $ | | |||||||||
See the accompanying notes to the consolidated financial statements
4
LOOP MEDIA, INC. AND SUBSIDIARIES
CONDENSED CONSOLIDATED STATEMENTS OF CASH FLOWS
(UNAUDITED)
Three months ended December 31, | ||||||
| 2021 |
| 2020 | |||
CASH FLOWS FROM OPERATING ACTIVITIES |
|
|
|
| ||
Net loss | $ | ( | $ | ( | ||
Adjustments to reconcile net loss to net cash used in operating activities: |
|
|
|
| ||
Amortization of debt discount |
| |
| | ||
Depreciation and amortization expense |
| |
| | ||
Amortization of license contract assets | | | ||||
Amortization of right-of-use assets |
| |
| | ||
Bad debt expense | | | ||||
Gain on extinguishment of debt | ( | ( | ||||
Change in fair value of derivative | ( | — | ||||
Warrants issued for consulting services | — | | ||||
Stock-based compensation |
| |
| | ||
Loss on settlement of obligations | — | | ||||
Impairment of intangible assets |
| — |
| | ||
Accounts receivable |
| ( |
| | ||
Prepaid income tax | ( | | ||||
Inventory |
| |
| ( | ||
Prepaid expenses |
| ( |
| | ||
Deposit |
| ( |
| | ||
Accounts payable and accrued liabilities |
| |
| | ||
License content liability |
| ( |
| | ||
License contract asset | — | ( | ||||
Operating lease liabilities |
| ( |
| ( | ||
Deferred income |
| ( |
| | ||
NET CASH USED IN OPERATING ACTIVITIES |
| ( |
| ( | ||
CASH FLOWS FROM INVESTING ACTIVITIES |
|
|
|
| ||
Acquisition of EON Media Group, net of cash acquired |
| — |
| ( | ||
Purchase of equipment | — | | ||||
Collection of note receivable |
| — |
| | ||
NET CASH USED IN INVESTING ACTIVITIES |
| — |
| ( | ||
CASH FLOWS FROM FINANCING ACTIVITIES |
|
|
|
| ||
Proceeds from issuance of common stock | | | ||||
Proceeds from issuance of convertible debt | — | | ||||
Repayment of stockholder loans |
| ( |
| ( | ||
Proceeds from issuing common stock subscribed |
| — |
| | ||
NET CASH PROVIDED BY FINANCING ACTIVITIES |
| |
| | ||
Change in cash and cash equivalents |
| ( |
| ( | ||
Cash, beginning of period |
| |
| | ||
Cash, end of period | $ | | $ | | ||
SUPPLEMENTAL DISCLOSURES OF CASH FLOW STATEMENTS |
|
|
|
| ||
Cash paid for interest | $ | | $ | | ||
Cash paid for income taxes | $ | | $ | | ||
SUPPLEMENTAL DISCLOSURES OF NON CASH INVESTING AND FINANCING ACTIVITIES |
|
|
|
| ||
Shares issued for asset purchase | $ | — | $ | | ||
Beneficial conversion feature of convertible debt | $ | — | $ | | ||
Shares issued for debt settlement | $ | — | $ | | ||
Shares issued for license content assets | $ | — | $ | | ||
Shares issued for investment in unconsolidated entity | $ | — | $ | | ||
See the accompanying notes to the consolidated financial statements
5
LOOP MEDIA, INC. AND SUBSIDIARIES
NOTES TO CONDENSED CONSOLIDATED FINANCIAL STATEMENTS
DECEMBER 31, 2021
(UNAUDITED)
NOTE 1 – BUSINESS
Loop Media Inc. (the “Company”; formerly Interlink Plus, Inc.) is a Nevada corporation. We were incorporated under the laws of the State of Nevada on May 11, 2015.
We are a multichannel digital video platform media company that uses marketing technology, or “MarTech,” to generate our revenue and fuel our services. Our technology and vast library of videos and licensed content enable us to curate and deliver short-form videos to our out-of-home (“OOH”) dining, hospitality, retail and other customers to enable them to inform, entertain and engage their customers. Our technology provides OOH customers and third-party advertisers with a targeted marketing and promotional tool for their products and services and allows us to measure the number of potential viewers of such advertising and promotional materials. In addition to providing services to OOH venue operators, we provide our services direct to consumers (“D2C”) in their homes and on their mobile devices.
We offer self-curated music video content licensed from major and independent record labels, as well as movie, television and video game trailers, kid-friendly videos, viral videos, drone footage, news headlines, and lifestyle and atmospheric channels. We believe we are the only service in the United States that has OOH and D2C licenses with all three major music labels. These licenses allow us to provide music video content in both the OOH and D2C markets. Our OOH services are complimented by our mobile app (the “Loop App”), which allows users to follow each other, share their locations and playlists, view activity, and signal support for a music video.
We curate content into playlists for OOH locations and into streaming channels for delivery to our over-the-top (“OTT”) platform customers and our mobile application users. Our digital platform service seeks to surround and engage consumers with a diverse offering of video content on their chosen digital screen wherever they are located. Our services include both an ad-supported service, which offers content on a free or unpaid advertising supported basis, and a subscription service, which offers content on a paid subscription basis. We deliver our services to OOH locations primarily through our proprietary Loop Media-designed “small-box” streaming Android media player (the “Loop Player”) and direct to consumers through our fully functional and operational Loop App and across OTT streaming platforms on connected TVs.
Going concern and management’s plans
As of December 31, 2021, we had cash of $
Our primary source of operating funds since inception has been cash proceeds from debt and equity financing transactions. Our ability to continue as a going concern is dependent upon our ability to generate sufficient revenue and our ability to raise additional funds by way of our debt and equity financing efforts.
The accompanying unaudited consolidated financial statements have been prepared on a going concern basis, which contemplates the realization of assets and the satisfaction of liabilities in the normal course of business. These unaudited consolidated financial statements do not include any adjustments relating to the recovery of the recorded assets or classification of the liabilities that might be necessary if we are unable to continue as a going concern. Our ability to continue as a going concern is dependent on management’s further implementation of our on-going and strategic plans, which include continuing to raise funds through equity and/or debt raises. If we are unable to raise adequate funds, certain aspects of the on-going and strategic plans may require modification. Management is in the process of identifying sources of capital via strategic partnerships, debt refinancing and equity investments through one or more private placements.
6
COVID-19
The continuing spread of COVID-19 around the world is affecting the United States and global economies and has affected our operations and those of third parties on which we rely, including disruptions in staffing, order fulfillment and demand for the product. In addition, the COVID-19 pandemic has in the past and may affect our revenue significantly in the future. Additionally, while the potential economic impact brought by, and the duration of the COVID-19 pandemic is difficult to assess or predict, the impact of the COVID-19 pandemic on the global financial markets may reduce our ability to access capital, which could negatively impact our short-term and long-term liquidity. The continuing impact of the COVID-19 pandemic is highly uncertain and subject to change.
As COVID-19 continues to evolve, the extent to which the coronavirus impacts operations will depend on future developments, which are highly uncertain and cannot be predicted with confidence, including the duration and severity of the outbreak, and the actions that may be required to contain the coronavirus or treat its impact. We continue to monitor the pandemic and, the extent to which the continued spread of the virus adversely affects our customer base and therefore revenue. As the COVID-19 pandemic is complex and rapidly evolving, our plans as described above may change. At this point, we cannot reasonably estimate the duration and severity of this pandemic, which could have a material adverse impact on the business, results of operations, financial position, and cash flows.
NOTE 2 – SUMMARY OF SIGNIFICANT ACCOUNTING POLICIES
Interim Financial Statements
The following (a) condensed consolidated balance sheet as of September 30, 2021, which has been derived from our audited financial statements, and (b) our unaudited condensed consolidated interim financial statements for the three months ended December 31, 2021, have been prepared in accordance with accounting principles generally accepted in the United States ("US GAAP") for interim financial information and the instructions to Form 10-Q and Rule 8-03 of Regulation S-X of the Securities Act of 1933. Accordingly, they do not include all of the information and footnotes required by US GAAP for complete financial statements. In the opinion of management, all adjustments (consisting of normal recurring accruals) considered necessary for a fair presentation have been included. Operating results for the three months ended December 31, 2021, are not necessarily indicative of results that may be expected for the year ending September 30, 2022.
These unaudited condensed consolidated financial statements should be read in conjunction with the audited consolidated financial statements and notes thereto for the year ended September 30, 2021, included in our Annual Report on Form 10-KT filed with the Securities and Exchange Commission ("SEC") on January 21, 2022.
Basis of presentation
The unaudited condensed consolidated financial statements are prepared using the accrual basis of accounting in accordance with US GAAP. All inter-company transactions and balances have been eliminated on consolidation.
Use of estimates
The preparation of the unaudited condensed consolidated financial statements in conformity with US GAAP requires management to make estimates and assumptions that affect the reported amounts of assets and liabilities and disclosure of contingent assets and liabilities at the date of the financial statements and the reported amounts of revenue and expenses during the reporting period. Actual results could differ from those estimates. Significant estimates include assumptions used in the fair value of stock-based compensation, the fair value of other equity and debt instruments, fair value of intangible assets and recoverability of license content assets.
Business combinations
We account for business acquisitions under Accounting Standards Codification (“ASC”) 805, Business Combinations. The total purchase consideration for an acquisition is measured as the fair value of the assets given, equity
7
instruments issued and liabilities assumed on the acquisition date. Costs that are directly attributable to the acquisition are expenses as incurred. Identifiable assets (including intangible assets), liabilities assumed (including contingent liabilities) and noncontrolling interests in an acquisition are measured initially at their fair values on the acquisition date. We recognize goodwill if the fair value of the total purchase consideration and any noncontrolling interest is in excess of the net fair value of the identifiable assets and the liabilities assumed. The results of operations of the acquired business are included in the consolidated financial statements beginning on the acquisition date.
Variable interest entities (“VIE”)
Variable interests are contractual, ownership or other monetary interests in an entity that change with fluctuations in the fair value of the entity’s net assets exclusive of variable interests. A VIE can arise from items such as lease agreements, loan arrangements, guarantees or service contracts. An entity is a VIE if (a) the entity lacks sufficient equity or (b) the entity’s equity holders lack power or the obligation and right as equity holders to absorb the entity’s expected losses or to receive its expected residual returns.
If an entity is determined to be a VIE, the entity must be consolidated by the primary beneficiary. The primary beneficiary is the holder of the variable interests that has the power to direct the activities of a VIE that most significantly impact the VIE’s economic performance and has the obligation to absorb losses of or the right to receive benefits from the VIE that could potentially be significant to the VIE. Therefore, we must identify which activities most significantly impact the VIE’s economic performance and determine whether it, or another party, has the power to direct those activities. As of December 31, 2021, and September 30, 2021, we had
Segment reporting
We report as
Cash
Cash and cash equivalents include all highly liquid monetary instruments with original maturities of three months or less when purchased. These investments are carried at cost, which approximates fair value. Financial instruments that potentially subject us to concentrations of credit risk consist primarily of cash deposits. We maintain our cash in institutions insured by the Federal Deposit Insurance Corporation (“FDIC”). At times, our cash and cash equivalent balances may be uninsured or in amounts that exceed the FDIC insurance limits. We have not experienced any loses on such accounts. On December 31, 2021, and September 30, 2021, we had
As of December 31, 2021, and September 30, 2021, approximately $
Accounts receivable
Accounts receivable represent amounts due from customers. We assess the collectability of receivables on an ongoing basis. A provision for the impairment of receivables involves significant management judgment and includes the review of individual receivables based on individual customers, current economic trends and analysis of historical bad debts. As of December 31, 2021, and September 30, 2021, we recorded an allowance for doubtful accounts of $
Concentration of credit risk
We grant credit in the normal course of business to our customers. Periodically, we review past due accounts and makes decisions about future credit on a customer by customer basis. Credit risk is the risk that one party to a financial instrument will cause a loss for the other party by failing to discharge an obligation.
Our concentration of credit risk was not significant as of December 31, 2021, and September 30, 2021.
8
License Content Asset
On January 1, 2020, we adopted the guidance in ASU 2019-02, Entertainment—Films—Other Assets—Film Costs (Subtopic 926-20) and Entertainment—Broadcasters—Intangibles—Goodwill and Other (Subtopic 920-350): Improvements to Accounting for Costs of Films and License Agreements for Program Materials, on a prospective basis. We capitalize the fixed content fees and our corresponding liability when the license period begins, the cost of the content is known, and the content is accepted and available for streaming. If the licensing fee is not determinable or reasonably estimable, no asset or liability is recorded, and licensing costs are expensed as incurred. We amortize licensed content assets into cost of revenue, using the straight-line method over the contractual period of availability. The liability is paid in accordance with the contractual terms of the arrangement.
Goodwill and other intangible assets
Goodwill represents the excess of the purchase consideration over the fair value of the net tangible and identifiable intangible assets acquired in a business combination. Goodwill and other intangible assets determined to have an indefinite useful life are not amortized but are subject to impairment tests. We conduct our annual impairment tests or whenever events and changes in circumstances suggest that the carrying amount may not be recoverable. We conducted the annual impairment test on September 30, 2021.
When evaluating goodwill and indefinite-lived intangible assets for impairment, we may first perform an assessment of qualitative factors to determine if the fair value of the reporting unit or the intangible asset is more-likely-than-not greater than the carrying amount. Significant factors considered in this assessment include, but are not limited to, macro-economic conditions, market and industry conditions, cost considerations, the competitive environment, overall financial performance, and results of past impairment tests. If, based on a review of the qualitative factors, we determine it is more-likely-than-not that the fair value is greater than the carrying value, we may bypass a quantitative test for impairment.
In performing the quantitative test for impairment of goodwill, we compare the fair value of each reporting unit with it carrying amount, including goodwill, in order to identify a potential impairment. Measurement of the fair value of a reporting unit is based on a fair value measure using the sum of the discounted estimated future cash flows. Estimates of forecasted cash flows involve measurement uncertainty, and it is therefore possible that reductions in the carrying value of goodwill may be required in the future because of changes in management’s future cash flow estimates. When the fair value of a reporting unit is less than it carrying amount, goodwill of the reporting unit is considered to be impaired. Effective January 1, 2020, we adopted the guidance in Accounting Standards Update (“ASU”) 2017-04, Simplifying the Test for Goodwill Impairment, which measures impairment amount as the excess of a reporting unit’s carrying amount over its fair value as determined by the quantitative test.
Operating leases
We determine if an arrangement is a lease at inception. Operating lease right-of-use assets (“ROU assets”) and short-term and long-term lease liabilities are included on the face of the consolidated balance sheet.
ROU assets represent the right to use an underlying asset for the lease term and lease liabilities represent the Company’s obligation to make lease payments arising from the lease. Operating lease ROU assets and liabilities are recognized at commencement date based on the present value of lease payments over the lease term. As most of the Company’s leases do not provide an implicit rate, we use an incremental borrowing rate based on the information available at commencement date in determining the present value of lease payments. Our lease terms may include options to extend or terminate the lease when it is reasonably certain that we will exercise that option. Lease expense for lease payments is recognized on a straight-line basis over the lease term. We have lease agreements with lease and non-lease components, which are accounted for as a single lease component. For lease agreements with terms less than 12 months, we have elected the short-term lease measurement and recognition exemption, and recognize such lease payments on a straight-line basis over the lease term.
9
Fair value measurement
We determine the fair value of our assets and liabilities using a hierarchy established by the accounting guidance that prioritizes the inputs to valuation techniques used to measure fair value. The hierarchy gives the highest priority to valuations based upon unadjusted quoted prices in active markets for identical assets or liabilities (Level 1 measurements) and the lowest priority to valuations based upon unobservable inputs that are significant to the valuation (Level 3 measurements). The three levels of valuation hierarchy are defined as follows:
| ● | Level 1 inputs to the valuation methodology are quoted prices for identical assets or liabilities in active markets. |
| ● | Level 2 inputs to the valuation methodology included quoted prices for similar assets and liabilities in active markets, quoted prices for identical or similar assets in inactive markets, and inputs that are observable for the asset or liability, either directly or indirectly, for substantially the full term of the financial instrument. |
| ● | Level 3 inputs to the valuation methodology is one or more unobservable inputs which are significant to the fair value measurement. |
The carrying amount of our financial instruments, including cash, accounts receivable, deposits, short-term portion of notes receivable and notes payable, and current liabilities approximate fair value due to their short-term nature. We do not have financial assets or liabilities that are required under US GAAP to be measured at fair value on a recurring basis. We have not elected to use fair value measurement option for any assets or liabilities for which fair value measurement is not presently required.
We record assets and liabilities at fair value on nonrecurring basis as required by US GAAP. Assets recognized or disclosed at fair value in the condensed consolidated financial statements on a nonrecurring basis include items such as property and equipment, operating lease assets, goodwill, and other intangible assets, which are measured at fair value if determined to be impaired.
The following table summarizes changes in fair value measurements of the Derivative Liability during the three months ended December 31, 2021:
Quoted Prices in |
| Significant |
| ||||||||
Active Markets | Significant Other | Unobservable | |||||||||
For Identical Items | Observable Inputs | Inputs | |||||||||
(Level 1) | (Level 2) | (Level 3) | Total | ||||||||
Derivative liabilities | — | — | | | |||||||
Total | $ | — | $ | — | $ | | $ | |
The following table summarizes changes in fair value measurements of the Derivative Liability during the three months ended September 30, 2021:
Quoted Prices in |
| Significant |
| ||||||||
Active Markets | Significant Other | Unobservable | |||||||||
For Identical Items | Observable Inputs | Inputs | |||||||||
(Level 1) | (Level 2) | (Level 3) | Total | ||||||||
Derivative liabilities | — | — | | | |||||||
Total | $ | — | $ | — | $ | | $ | |
10
The following table summarizes changes in fair value measurements of the Derivative Liability during the three months ended December 31, 2021:
|
| |||
Balance as of September 30, 2021 | $ | | ||
Change in fair value |
| ( | ||
Balance as of December 31, 2021 | $ | | ||
The following table summarizes the unobservable inputs used in the valuation of the derivatives during the three months ended December 31, 2021:
Expected term | |
Discount rate | |
Volatility |
Convertible debt and derivative treatment
When we issue debt with a conversion feature, we must first assess whether the conversion feature meets the requirements to be treated as a derivative, as follows: a) one or more underlyings, typically the price of our common stock; b) one or more notional amounts or payment provisions or both, generally the number of shares upon conversion; c) no initial net investment, which typically excludes the amount borrowed; and d) net settlement provisions, which in the case of convertible debt generally means the stock received upon conversion can be readily sold for cash. An embedded equity-linked component that meets the definition of a derivative does not have to be separated from the host instrument if the component qualifies for the scope exception for certain contracts involving an issuer’s own equity. The scope exception applies if the contract is both a) indexed to its own stock, and b) classified in shareholders’ equity in its statement of financial position.
If the conversion feature within convertible debt meets the requirements to be treated as a derivative, we estimate the fair value of the convertible debt derivative using the Monte Carlo Method upon the date of issuance. If the fair value of the convertible debt derivative is higher than the face value of the convertible debt, the excess is immediately recognized as interest expense. Otherwise, the fair value of the convertible debt derivative is recorded as a liability with an offsetting amount recorded as a debt discount, which offsets the carrying amount of the debt. The convertible debt derivative is revalued at the end of each reporting period and any change in fair value is recorded as a gain or loss in the statement of operations. The debt discount is amortized through interest expense over the life of the debt.
Convertible debt and beneficial conversion features
If the conversion feature is not treated as a derivative, we assess whether it is a beneficial conversion feature (“BCF”). A BCF exists if the conversion price of the convertible debt instrument is less than the stock price on the commitment date. This typically occurs when the conversion price is less than the fair value of the stock on the date the instrument was issued. The value of a BCF is equal to the intrinsic value of the feature, the difference between the conversion price and the common stock into which it is convertible and is recorded as additional paid in capital and as a debt discount in the consolidated balance sheets. We amortize the balance over the life of the underlying debt as amortization of debt discount expense in the consolidated statements of operations. If the debt is retired early, the associated debt discount is then recognized immediately as amortization of debt discount expense in the consolidated statements of operations.
If the conversion feature does not qualify for either the derivative treatment or as a BCF, the convertible debt is treated as traditional debt.
11
Advertising costs
We expense all advertising costs as incurred. Advertising and marketing costs for the three months ended December 31, 2021, and 2020 were $
Revenue recognition
We recognize revenue in accordance with ASC 606, Revenue from Contracts with Customers, when it satisfies a performance obligation by transferring control over a product to a customer. Revenue is measured based on the consideration we expect to receive in exchange for those products. In instances where final acceptance of the product is specified by the customer, revenue is deferred until all acceptance criteria have been met. Revenues are recognized under Topic 606 in a manner that reasonably reflects the delivery of our products and services to customers in return for expected consideration and includes the following elements:
| ● | executed contracts with our customers that it believes are legally enforceable; |
| ● | identification of performance obligations in the respective contract; |
| ● | determination of the transaction price for each performance obligation in the respective contract; |
| ● | allocation of the transaction price to each performance obligation; and |
| ● | recognition of revenue only when we satisfy each performance obligation. |
Performance obligations and significant judgments
Our revenue streams can be categorized into the following performance obligations and recognition patterns:
| o | Delivery of streaming services including content encoding and hosting. We recognize revenue over the term of the service based on bandwidth usage. |
| o | Delivery of subscription content services in customized formats. We recognize revenue over the term of the service. |
| o | Delivery of hardware for ongoing subscription content delivery through software. We recognize revenue at the point of hardware delivery. |
| o | Revenue share arrangements, where platform providers distribute our licensed content and providers pay us a portion of the usage-based advertising revenues. |
Transaction prices for performance obligations are explicitly outlined in relevant agreements; therefore, we do not believe that significant judgments are required with respect to the determination of the transaction price, including any variable consideration identified.
Customer acquisition costs
We record commission expense associated with subscription revenue. Commissions are included in operating expenses. We have elected the practical expedient that allows us to recognize the incremental costs of obtaining a contract as an expense when incurred if the amortization period of the asset that we otherwise would have recognized is one year or less.
12
Cost of revenue
Cost of revenue represents the cost of the delivered hardware and related bundled software and is recognized at the time of sale. For ongoing licensing and hosting fees, cost of sales is recognized over time based on usage patterns.
Deferred income
We bill subscription services in advance of when the service period is performed. The deferred income recorded at December 31, 2021, and September 30, 2021, represents our accounting for the timing difference between when the subscription fees are received and when the performance obligation is satisfied.
Net loss per share
We account for net loss per share in accordance with ASC subtopic 260-10, Earnings Per Share (“ASC 260-10”), which requires presentation of basic and diluted earnings per share (“EPS”) on the face of the statement of operations for all entities with complex capital structures and requires a reconciliation of the numerator and denominator of the basic EPS computation to the numerator and denominator of the diluted EPS.
Basic net loss per share is computed by dividing net loss attributable to common stockholders by the weighted average number of shares of common stock outstanding during each period. It excludes the dilutive effects of any potentially issuable common shares.
Diluted net loss per share is calculated by including any potentially dilutive share issuances in the denominator.
The following securities are excluded from the calculation of weighted average diluted shares at December 31, 2021, and December 31, 2020, respectively, because their inclusion would have been anti-dilutive.
| December 31, |
| December 31, | |
2021 | 2020 | |||
Options to purchase common stock |
| |
| |
Warrants to purchase common stock |
| |
| |
Series A preferred stock |
| — |
| |
Series B preferred stock |
| |
| |
Convertible debentures |
| |
| |
Total common stock equivalents |
| |
| |
Stock-based compensation
Share-based compensation issued to employees is measured at the grant date, based on the fair value of the award, and is recognized as an expense over the requisite service period. We measure the fair value of the share-based compensation issued to non-employees using the stock price observed in the trading market (for stock transactions) or the fair value of the award (for non-stock transactions), which were more reliably determinable measures of fair value than the value of the services being rendered. The measurement date is the earlier of (1) the date at which commitment for performance by the counterparty to earn the equity instruments is reached, or (2) the date at which the counterparty’s performance is complete.
13
NOTE 3 – INVENTORY
Our finished goods inventory consisted of the following on December 31, 2021, and September 30, 2021:
| December 31, |
| September 30, | |||
2021 | 2021 | |||||
Computers | $ | | $ | | ||
Hasp keys |
| |
| | ||
Loop player |
| |
| | ||
Total inventory | $ | | $ | | ||
NOTE 4 – LICENSE CONTENT ASSETS
License Content Assets
To stream video content to the users, we generally secure intellectual property rights to such content by obtaining licenses from, and paying royalties or other consideration to, rights holders or their agents. The licensing arrangements can be for a fixed fee, variable fee, or combination of both. The licensing arrangements specify the period when the content is available for streaming. The license content assets are
As of December 31, 2021, license content assets were $
We recorded amortization expense of $
License Content Liabilities
On December 31, 2021, we had $
NOTE 5. GOODWILL AND OTHER INTANGIBLE ASSETS
As of December 31, 2021, and September 30, 2021, the balance of goodwill was $
Our other intangible assets, each definite lived assets, consisted of the following as of December 31, 2021, and September 30, 2021:
December 31, |
| September 30, | ||||||
14
| Useful life |
| 2021 |
| 2021 | |||
Customer relationships | $ | | $ | | ||||
Content library |
| |
| | ||||
Total intangible assets, gross |
| |
| | ||||
Less: accumulated amortization |
| ( |
| ( | ||||
Total |
| ( |
| ( | ||||
Total intangible assets, net | $ | | $ | | ||||
Amortization expense charged to operations amounted to $
Annual amortization expense for the next five years and thereafter is estimated to be $80,041 (remaining in 2022), $
NOTE 6 – LEASES
Operating leases
We have operating leases for office space and office equipment. Many leases include one or more options to renew, some of which include options to extend the leases for a long-term period, and some leases include options to terminate the leases within 30 days. In certain of our lease agreements, the rental payments are adjusted periodically to reflect actual charges incurred for capital area maintenance, utilities, inflation and/or changes in other indexes.
| December 31, |
| September 30, | |||
2021 | 2021 | |||||
Short term portion | $ | | $ | | ||
Long term portion |
| |
| | ||
Total lease liability | $ | | $ | | ||
Maturity analysis under these lease agreements are as follows:
| |||
2022 | $ | | |
2023 |
| | |
Total undiscounted cash flows |
| | |
Less: 10% Present value discount |
| ( | |
Lease liability | $ | |
Three months ended December 31. | ||||||
| 2021 |
| 2020 | |||
Operating lease expense | $ | | $ | | ||
Short-term lease expense |
| |
| | ||
Total lease expense | $ | | $ | | ||
Operating lease expense is included in selling, general and administration expenses in the consolidated statement of operations.
15
For the three months ended December 31, 2021, cash payments against lease liabilities totaled $
For the three months ended December 31, 2020, cash payments against lease liabilities totaled $
Weighted-average remaining lease term and discount rate for operating leases are as follows:
Weighted-average remaining lease term |
| ||
Weighted-average discount rate |
| | % |
NOTE 7 – ACCOUNTS PAYABLE AND ACCRUED EXPENSES
Accounts payable and accrued expenses consisted of the following as of December 31, 2021, and September 30, 2021:
| December 31, |
| September 30, | |||
2021 | 2021 | |||||
Accounts payable | $ | | $ | | ||
Interest payable |
| |
| | ||
Accrued liabilities |
| |
| | ||
Payroll liabilities |
| |
| | ||
Total accounts payable and accrued expenses | $ | | $ | | ||
NOTE 8 – NOTE PAYABLE
PPP loan
On December 28, 2021, we received a notification from the Small Business Association for the full forgiveness of the PPP loan of $
16
NOTE 9 – CONVERTIBLE DEBENTURES PAYABLE
Convertible debentures as of December 31, 2021: | ||||||||||||||||
Unpaid | Contractual | |||||||||||||||
Net Carrying Value | Principal | Interest Rates | Contractual | Warrants | ||||||||||||
Related party convertible debentures: | Current | Long Term | Balance | Cash | PIK | Maturity Date | issued | |||||||||
$ | (1) | $ | |
| $ | | $ | | | |||||||
$ | (2) | | — | | | |||||||||||
$ | (2) | | — | | | |||||||||||
$ | (2) | | — | | | |||||||||||
$ | (2) | | — | | | |||||||||||
Total related party convertible debentures, net | $ | | $ | | $ | | ||||||||||
Convertible debentures: | ||||||||||||||||
$ | (2) | | — | | | |||||||||||
$ | (2) | | — | | | |||||||||||
Total convertible debentures, net | $ | | $ | — | $ | | ||||||||||
Convertible debentures as of September 30, 2021: | ||||||||||||||||
Unpaid | Contractual | |||||||||||||||
Net Carrying Value | Principal | Interest Rates | Contractual | Warrants | ||||||||||||
Related party convertible debentures: | Current | Long Term | Balance | Cash | PIK | Maturity Date | issued | |||||||||
$ | (1) | $ | | $ | | $ | | | ||||||||
$ | (2) | — | | | | |||||||||||
$ | (2) | — | | | | |||||||||||
$ | (2) | — | | | | |||||||||||
$ | (2) | — | | | | |||||||||||
Total related party convertible debentures, net | $ | | $ | | $ | | ||||||||||
Convertible debentures: | ||||||||||||||||
$ | (3) | — | | | | |||||||||||
$ | (4) | — | | | | |||||||||||
Total convertible debentures, net | $ | — | $ | | $ | | ||||||||||
1) Unsecured convertible debentures (at $
17
maturity in whole or in parts into our common shares at a price of $
(2) On December 1, 2020, we offered, in a private placement, the aggregate offering amount of up to $
We treated the conversion feature as a derivative instrument. At the option of the Senior Secured Promissory Note holders, the notes are convertible at the earlier of a change of control event, a Qualified IPO, both of which are defined in the Promissory Note Agreement or the maturity date of December 1, 2022. If the conversion takes place at the maturity date, the note will be converted in whole or in parts (which cannot be less than 50% of the amount due under the note) into an amount of shares equal to the amount due divided by the average of the VWAP of common stock during each trading day during the thirty trading day period ending one trading day prior to the maturity date. If the conversion takes place at the change of control date, the note will be converted into an amount of shares equal to the amount due divided by the average of the VWAP of common stock during each trading day during the ten trading day period ending one trading day prior to the change of control effective date. In the event of a Qualified IPO, but subject to the closing of such Qualified IPO, the amount due shall convert in full on the closing date of such Qualified IPO into a number of shares equal to the amount due on such closing date divided by the applicable IPO conversion price, as defined in the Promissory Note Agreement.
The Senior Secured Promissory Debentures under the offering accrue cash interest at
| ● | $ |
| ● | $ |
| ● | $ |
| ● | $ |
| ● | $ |
| ● | $ |
18
The following table presents the interest expense related to the contractual interest coupon and the amortization of debt discounts on the convertible debentures:
Three months ended December 31, | |||||
2021 | 2020 | ||||
Interest expense | $ | | $ | | |
Amortization of debt discounts | | ||||
Total | $ | | $ | | |
| |||
For the nine months remaining 2022 | $ | ||
2023 |
| ||
2024 |
| | |
Convertible debentures payable, related and non related party |
| ||
Less: Debt discount on convertible debentures payable |
| ( | |
Total convertible debentures payable, related and non related party, net | $ | |
19
NOTE 10 – COMMITMENTS AND CONTINGENCIES
We may be involved in legal proceedings, claims and assessments arising in the ordinary course of business. Such matters are subject to many uncertainties, and outcomes are not predictable with assurance. There are
NOTE 11 – RELATED PARTY TRANSACTIONS
Related parties are natural persons or other entities that have the ability, directly or indirectly, to control another party or exercise significant influence over the party making financial and operating decisions. Related parties include other parties that are subject to common control or that are subject to common significant influences.
We borrowed funds for business operations from a certain stockholder and board member through convertible debenture agreements and have remaining balances, including accrued interest amounting to $
NOTE 12 –STOCKHOLDERS’ EQUITY (DEFICIT)
Convertible Preferred Stock
Of the
Each share of Series B Preferred Stock has a liquidation preference of $
Common stock
Our authorized capital stock consists of
Three months ended December 31, 2021
See Note 13 – Stock Options and Warrants for stock compensation discussion.
Three months ended December 31, 2020
During the three months ended December 31, 2020, we issued an aggregate of
20
During the three months ended December 31, 2020, we received $
During the three months ended December 31, 2020, we issued
During the three months ended December 31, 2020, we issued
During the three months ended December 31, 2020, we issued warrants valued at $
During the three months ended December 31, 2020, we issued
During the three months ended December 31, 2020, we issued
NOTE 13 – STOCK OPTIONS AND WARRANTS
Options
Option valuation models require the input of highly subjective assumptions. The fair value of stock-based payment awards was estimated using the Black-Scholes option model with a volatility figure derived from using our historical stock prices. We account for the expected life of options based on the contractual life of options for non-employees. For employees, our accounts for the expected life of options in accordance with the “simplified” method, which is used for “plain-vanilla” options, as defined in the accounting standards codification. The risk-free interest rate was determined from the implied yields of U.S. Treasury zero-coupon bonds with a remaining life consistent with the expected term of the options.
The following table summarizes the stock option activity for the three months ended December 31, 2021:
Weighted | Weighted Average | |||||||||
Average | Remaining | Aggregate | ||||||||
| Options |
| Exercise Price |
| Contractual Term |
| Intrinsic Value | |||
Outstanding at September 30, 2021 |
| | $ | |
| $ | | |||
Grants |
| | |
| — | |||||
Exercised |
| — |
| — |
| — |
| — | ||
Expired |
| — |
| — |
| — |
| — | ||
Forfeited |
| ( |
| |
| — |
| ( | ||
Outstanding at December 31, 2021 |
| | $ | |
| $ | | |||
Exercisable at December 31, 2021 |
| | $ | |
| $ | | |||
The aggregate intrinsic value in the preceding tables represents the total pretax intrinsic value, based on options with an exercise price less than our stock price of $
21
The following table presents information related to stock options on December 31, 2021:
Options outstanding | ||||||
Weighted | Options | |||||
average | exercisable | |||||
Exercise | Number of | remaining life | number of | |||
price |
| options |
| in years |
| options |
|
| |
|
| | |
|
| |
|
| | |
| | | ||||
| | | ||||
| | | ||||
| | | ||||
|
| | | |||
|
| |
|
| | |
| | — | ||||
| | | ||||
| | | ||||
| | |||||
Stock-based compensation
We recognize compensation expense for all stock options granted using the fair value-based method of accounting. During the three months ended December 31, 2021, we issued
We calculated the fair value of options issued using the Black-Scholes option pricing model, with the following assumptions:
| December 31, 2021 |
| ||
Weighted average fair value of options granted | $ | |||
Expected life |
| |||
Risk-free interest rate |
| % | ||
Expected volatility |
| % | ||
Expected dividends yield |
| | % | |
Forfeiture rate |
| | % | |
The stock-based compensation expense related to option grants was $
22
Warrants
The following table summarizes the changes in warrants outstanding and the related prices for the shares of our common stock:
Warrants outstanding | Warrants exercisable | |||||||||||
Weighted | Weighted | |||||||||||
average | average | |||||||||||
remaining | Weighted | remaining | ||||||||||
contractual | average | contractual | ||||||||||
Number | life | exercise | Number | life | ||||||||
Exercise prices |
| outstanding |
| (years) | price |
| exercisable |
| (years) | |||
$ | $ | |||||||||||
The following table summarizes the warrant activity for the nine months ended December 31, 2021:
|
| Weighted | |||
average | |||||
exercise | |||||
Number of | price per | ||||
shares | share | ||||
Outstanding at September 30, 2021 | $ | ||||
Issued | — | — | |||
Exercised | — | — | |||
Expired | — | — | |||
Outstanding at December 31, 2021 |
| | $ | | |
We record all warrants granted using the fair value-based method of accounting.
During the three months ended December 31, 2021, we issued
We calculated the fair value of warrants issued using the Black-Scholes option pricing model, with the following assumptions:
| December 31, 2021 | |||
Weighted average fair value of warrants granted | $ | |||
Expected life |
| |||
Risk-free interest rate |
| |||
Expected volatility |
| |||
Expected dividends yield |
| | % | |
Forfeiture rate |
| | % | |
23
NOTE 14 – INCOME TAXES
We calculate our interim income tax provision in accordance with ASC Topic 270, Interim Reporting and ASC Topic 740, Accounting for Income Taxes. At the end of each interim period, we estimate the annual effective tax rate and apply that rate to our ordinary year to date earnings. In addition, the tax effects of unusual or infrequently occurring items including changes in judgment about valuation allowances and effects of changes in enacted tax laws are recognized discretely in the interim period in which the change occurs. The computation of the annual estimated effective tax rate at each interim period requires certain estimates and significant judgment including the expected operating (loss) income for the year, permanent and temporary differences as a result of differences between amounts measured and recognized in accordance with tax laws and financial accounting standards, and the likelihood of recovering deferred tax assets generated in the current fiscal year. The accounting estimates used to compute income tax expense may change as new events occur or additional information is obtained.
For the three months ended December 31, 2021, we recorded an income tax provision of $
NOTE 15 – SUBSEQUENT EVENTS
We have evaluated all subsequent events through the date of filing, February 14, 2022, of this Report on Form 10-Q with the SEC, to ensure that this filing includes appropriate disclosure of events both recognized in the financial statements as of December 31, 2021, and events which occurred after December 31, 2021, but which were not recognized in the financial statements. We have determined that there were no subsequent events which required recognition, adjustment to or disclosure in the financial statements.
24
Item 2.Management’s Discussion and Analysis of Financial Condition and Results of Operations.
STATEMENT ON FORWARD-LOOKING INFORMATION
This report on Form 10-Q contains certain forward-looking statements. All statements other than statements of historical fact are “forward-looking statements” for purposes of these provisions, including any projections of earnings, revenues, or other financial items; any statements of the plans, strategies, and objectives of management for future operations; any statements concerning proposed new products, services, or developments; any statements regarding future economic conditions or performance; statements of belief; and any statement of assumptions underlying any of the foregoing. Such forward-looking statements are subject to inherent risks and uncertainties, and actual results could differ materially from those anticipated by the forward-looking statements.
These forward-looking statements involve significant risks and uncertainties, including, but not limited to, the following: competition, promotional costs and risk of declining revenues. Our actual results could differ materially from those anticipated in such forward-looking statements as a result of a number of factors. These forward-looking statements are made as of the date of this filing, and we assume no obligation to update such forward-looking statements. The following discusses our financial condition and results of operations based upon our financial statements which have been prepared in conformity with accounting principles generally accepted in the United States of America. It should be read in conjunction with our financial statements and the notes thereto included elsewhere herein.
The following discussion and analysis provides information which our management believes to be relevant to an assessment and understanding of our results of operations and financial condition. The discussion should be read together with our financial statements and the notes to the financial statements, which are included in this report.
Overview
We are a multichannel digital video platform media company that uses marketing technology, or “MarTech,” to generate our revenue and fuel our services. Our technology and vast library of videos and licensed content enables us to curate and deliver short-form videos to our out-of-home (“OOH”) dining, hospitality, retail and other partners to enable them to inform, entertain and engage their customers. Our technology provides OOH customers and third-party advertisers with a targeted marketing and promotional tool for their products and services and allows us to measure the number of potential viewers of such advertising and promotional materials. In addition to providing services to OOH venue operators, we provide our services direct to consumers (“D2C”) in their homes and on mobile devices.
We offer self-curated music video content from major and independent record labels, as well as movie, television and video game trailers, kid-friendly videos, viral videos, drone footage, news headlines, and lifestyle and atmospheric channels. We believe we are the only service in the United States that has OOH and D2C licenses with all three major music labels, Universal Music, Sony Music and Warner Music Group (collectively, the “Music Labels”). These licenses allow us to provide music video content in both the OOH and D2C markets. Our OOH services are complimented by our mobile app (the “Loop App”), which allows users to follow each other, share their locations and playlists, view activity, and signal support for a music video.
We curate content into playlists for OOH locations and into streaming channels for delivery to our over-the-top (“OTT”) platform customers and our mobile application users. Our digital platform service seeks to surround and engage consumers with a diverse offering of video content on their chosen digital screen wherever they are located. Our services include both out ad-supported service, which offers content on a free or unpaid advertising supported basis, and our premium service, which offers content on a paid subscription basis. We deliver our service to OOH venues primarily through our proprietary Loop Media-designed “small-box” streaming Android media player (the “Loop Player”) and direct to consumers primarily through our fully functional and operational Loop App and across OTT streaming platforms on connected TVs (“CTVs”).
25
Our Revenue Model
Our ad-supported and subscription-based services are separate offerings but work together to support our business. Given the expected growth in the digital OOH advertising market, coupled with the preferable economics to our ad-supported business model, we encourage our customers to choose our ad-supported services over our subscription services. While our ad-supported service is generally associated with higher margins, we provide our premium subscription service for OOH customers that are seeking an ad-free content offering.
MarTech
MarTech, the intersection of marketing and technology leverages data and analytics to expand our points of distribution and advertising revenue.
Distribution. Our current customer acquisition strategy is focused on marketing our Loop Player to businesses through social media and other online mediums. We seek to optimize our customer acquisition and the distribution of our Loop Players by analyzing various data, including our return on marketing investments. When analyzing the success of our marketing investments, we examine the number of sales leads obtained from online platforms and the conversion of leads into high quality customers. We regularly analyze the engagement with, and success of, our creative advertising content and modify our messaging to improve customer acquisition.
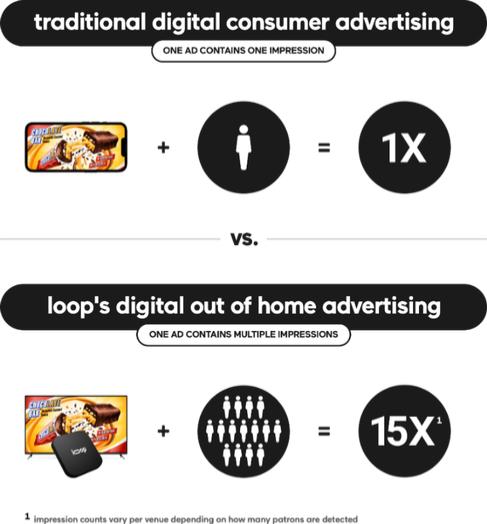
Advertising Revenue. We intend to increase revenue by leading with programmatic advertising, an automated measurement process that manages the sales of our advertising inventory. Today, most digital advertising is programmatic advertising, with digital OOH advertising comprising a small portion of the overall market. While we strive to establish direct advertising deals with advertisers, a significant part of our current advertising revenue is purposely secured through programmatic advertising. Our yield optimization strategies look to leverage data analytic and other techniques to maximize the value of our digital advertising inventory. We intend to optimize the combination of our ad impressions, cost per impression and the percentage of our ad inventory filled by advertisers, while balancing our customers’ experience by limiting the number of ads delivered during any given period. Our Loop Player is designed to allow us to multiply OOH revenue in certain locations, as outlined below:
26
Loop Player
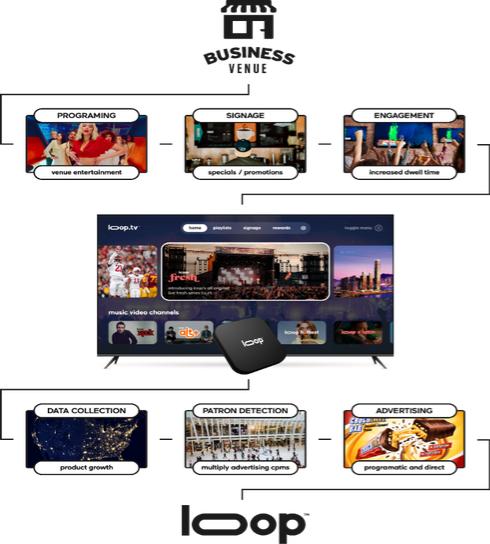
The Loop Player is at the heart of our revenue model and its technology enables us to communicate and interact with OOH locations, advertisers, and OOH customers:
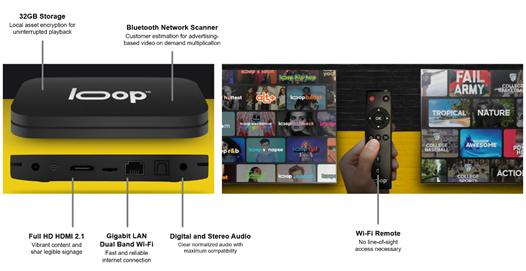
| ● | OOH Locations. The Loop Player allows OOH customers to program their in-store monitors and audio systems to schedule playlists depending on the time of day, promote their products or services through digital signage and deliver company-wide messages to staff in back-office locations. Business owners can filter content based on ratings or explicit language and can control the genres of videos in their programs. The Loop Player caches and encrypts our content, thereby supplying uninterrupted play for up to 12 hours in the event of an internet disruption. |
| ● | Advertising and Content Partners. Our Loop Player works with our technology, software and servers to determine the number of ad impressions available for programmatic advertising, which can be filled in real-time, seconds before ads are played. Our Loop Player delivers content and advertising to venues and our technology allows us to record and report video content played (for reporting to content providers) and advertising content played (for reporting to our advertising demand partners and advertisers). In particular, our technology allows us to track when, where and how long content is played, and measure approximately how many consumers were in position to view the content or advertisement. The Loop Player’s Wi-Fi and Bluetooth capabilities allow us to determine the number of potential viewers at a given location, which can provide us with a revenue multiplier, as we are able to increase advertising revenue at high-volume locations. This “multiplier effect” is possible due to the Loop Player’s ability to detect, using Bluetooth and Wi-Fi technology, the number of consumer mobile devices within reach of a Loop Player in an OOH location which provides advertisers with a proxy for the number of potential viewers of a particular ad at any given time. |
| ● | OOH Customers. We are seeking to further develop the interactivity between the Loop Player and the customers in OOH venues. This may take different forms, such as offering a simple thumbs up or thumbs down function, displaying the number of customer votes for a given piece of content, and downloading of menus from the screens and other functions. This will require further development of our mobile applications in the future. |
27
| ● | Loop Media. We are able to consistently monitor the preferences of the customers of our OOH customers and venue operators through our Loop Player. Our Loop Player allows us to collect specific information and data on content played, views, location, and location type, enabling us to effectively measure demand. These capabilities allow us to make informed decisions around which type of content to acquire or develop, as well as identify new market opportunities. |
Key Performance Indicators
We review our quarterly active users (“QAU”), among other key performance indicators, to evaluate our business, measure our performance, identify trends affecting our business, formulate financial projections and make strategic decisions. We define an “active user” as (i) an ad-supported Loop Player (or OOH location using our ad-supported service through our “Loop for Business” application or using our OOH location-owned computer screening our content) that is online, playing content, and has checked into the Loop analytics system at least once in the 90-day period or (ii) an OOH location customer using our subscription service at any time during the 90-day period. We use “QAU” to refer to the number of such active users during such period. Beginning October 1, 2021, we pre-activated almost all of our Loop Players prior to delivery to customers, in response to feedback from customers and in order to further streamline the installation process and simplify the use of the Loop Players in OOH locations. Pre-activated Loop Players are ordered by third-party OOH locations and represent potential revenue for us when the Loop Players are installed in the OOH locations. As a result of these operational changes, for any period following September 30, 2021, we will include in our definition of “active user” any Loop Player that has been pre-activated and shipped by us to an OOH location customer for a period of 90 days post shipment, regardless of whether such customers utilize the Loop Player in their OOH location. After the 90-day period, these Loop Players will drop out of the QAU definition, unless they are otherwise online, playing content, and checked into the Loop analytics system at least once in any subsequent 90-day period. Prior to October 1, 2021, if a Loop Player was not activated by the OOH location operator it would not be counted as an active user. Accordingly, our QAUs for periods subsequent to September 30, 2021, will not be strictly comparable to our September 30, 2021, or June 30, 2021, QAUs. Increases or decreases in our QAU may not correspond with increases or decreases in our revenue, and QAU may be calculated in a manner different than any similar key performance indicator used by other companies.
For the quarter ended December 31, 2021, QAU was 8,156, compared to 5,791 for the quarter ended September 30, 2021, a 41% increase.
For the quarter ended September 30, 2021, QAU was 5,791, compared to 4,296 for the quarter ended June 30, 2021, a 35% increase.
28
Seasonality
We have seen seasonality in our revenue and business related to advertising sales and the distribution of our Loop Player. This seasonality may not be reflected in our results of operations as we experienced overall growth in revenue in recent quarters and expect to continue to do so, which may obscure underlying seasonal trends. The underlying seasonality, nonetheless, may act to slow our revenue growth in any given period.
The first quarter of the calendar year (our second fiscal quarter) is traditionally the least profitable quarter in terms of revenue generation for ad publishers (such as us), as advertisers are holding and planning their budgets for the year and consumers tend to spend less after the winter holiday season. This results in fewer ad demands and lower CPMs. The second quarter of the calendar year, from April to June (our third fiscal quarter), typically experiences increased ad demand and higher CPMs over the first quarter, as advertisers start to spend their budgets in greater amounts. The third quarter of the calendar year, from July to September (our fourth fiscal quarter), typically sees a slight increase in CPMs and ad demands compared to the second quarter, even though consumers spend more time outdoors and less time online in the summer months. The fourth quarter of the calendar year, from October to December (our first fiscal quarter), is typically the most profitable quarter for publishers, as companies want their brands and products to be seen in the run-up to the holidays season. This generally results in publishers receiving the highest CPMs and the greatest ad demand for their ad impressions during the fourth quarter. As a result of these market trends for digital advertising we generally expect to receive higher CPMs and greater ad fill rates during the fourth quarter of a calendar year (our first fiscal quarter) and lower CPMs and reduced ad fill rates during the first quarter of a calendar year (our second fiscal quarter). We seek to offset the reduction in CPMs and ad fill rates with increased Loop Player distribution and ad impressions across our ad-supported services.
Critical Accounting Policies and Use of Estimates
License Content Assets
On January 1, 2020, we adopted the guidance in ASU 2019-02, Entertainment—Films—Other Assets—Film Costs (Subtopic 926-20) and Entertainment—Broadcasters—Intangibles—Goodwill and Other (Subtopic 920-350): Improvements to Accounting for Costs of Films and License Agreements for Program Materials, on a prospective basis. We capitalize the fixed content fees and its corresponding liability when the license period begins, the cost of the content is known, and the content is accepted and available for streaming. If the licensing fee is not determinable or reasonably estimable, no asset or liability is recorded, and licensing costs are expenses as incurred. We amortize licensed content assets into cost of revenue, using the straight-line method over the contractual period of availability. The liability is paid in accordance with the contractual terms of the arrangement.
Revenue
Revenue generated from content and streaming services, including content encoding and hosting, are recognized over the term of the service based on bandwidth usage. The revenue generated from content subscription services in customized formats is recognized over the term of the service. The revenue generated from hardware for ongoing subscription content delivery is recognized at the point of the hardware delivery.
Impairment of goodwill and intangibles
Goodwill impairment occurs when the carrying amount of a goodwill asset is greater than its fair value. The amount of the impairment is the difference between the two figures. Goodwill is recorded as part of a corporate acquisition, representing the excess of the price paid over the value of the underlying assets and liabilities of the acquiree.
Income taxes
We account for income taxes in accordance with ASC Topic 740, Income Taxes. ASC 740 requires a company to use the asset and liability method of accounting for income taxes, whereby deferred tax assets are recognized for deductible temporary differences, and deferred tax liabilities are recognized for taxable temporary differences. Temporary
29
differences are the differences between the reported amounts of assets and liabilities and their tax bases. Deferred tax assets are reduced by a valuation allowance when, in the opinion of management, it is more likely than not that some portion, or all of, the deferred tax assets will not be realized. Deferred tax assets and liabilities are adjusted for the effect of changes in tax laws and rates on the date of enactment.
Under ASC 740, a tax position is recognized as a benefit only if it is “more likely than not” that the tax position would be sustained in a tax examination, with a tax examination being presumed to occur. The amount recognized is the largest amount of tax benefit that is greater than 50% likely of being realized on examination. For tax positions not meeting the “more likely than not” test, no tax benefit is recorded. We have no material uncertain tax positions for any of the reporting periods presented.
Results of Operations
For the three months ended December 31, 2021, compared to the three months ended December 31, 2020
Three months ended | Three months ended |
| ||||||||
December 31 | December 31, |
| ||||||||
| 2021 |
| 2020 |
| $variance |
| % variance |
| ||
Total revenue |
| 2,996,034 |
| 705,168 |
| 2,290,866 |
| 325 | % | |
Cost of revenue |
| 1,444,977 |
| 462,042 |
| 982,935 |
| 213 | % | |
Gross profit |
| 1,551,057 |
| 243,126 |
| 1,307,931 |
| 538 | % | |
Total operating expenses |
| 5,909,680 |
| 5,427,097 |
| 482,583 |
| 9 | % | |
Loss from operations |
| (4,358,623) |
| (5,183,971) |
| 825,348 |
| (16) | % | |
Other income (expense): |
|
|
|
|
|
|
|
| ||
Interest income |
| 200 |
| 2,996 |
| (2,796) |
| (93) | % | |
Interest expense |
| (504,117) |
| (395,905) |
| (108,212) |
| 27 | % | |
Change in fair value of derivatives |
| 98,745 |
| — |
| 98,745 |
| N/A | % | |
Gain/(Loss) on extinguishment of debt, net |
| 490,051 |
| 13,900 |
| 476,151 |
| 3,426 | % | |
Gain/(loss) on settlement of obligation |
| — |
| (15,000) |
| 15,000 |
| (100) | % | |
Total other income (expense) |
| 84,879 |
| (394,009) |
| 478,888 |
| (122) | % | |
Provision for income taxes |
| (251) |
| (98,244) |
| 97,993 |
| 100 | % | |
Net loss | $ | (4,273,995) |
| (5,676,224) |
| 1,402,229 |
| (25) | % | |
Revenues
Our revenue increased for the three months ended December 31, 2021, from 2020 by $2,290,866, or 325%, primarily due to higher sales from the shift in mix from the in-home market to the new higher-margin OOH market strategy. Advertising revenue was higher in 2021 due to strong Q1 seasonality in customer viewing patterns. Subscription revenue increased due to more active users, in part due to new customers from additional OOH locations and in part due to our decision to pre-activate Loop Players prior to shipment so that new customers could begin using our content concurrent with installation.
Cost of revenue
Cost of revenue increased 213% from $462,042 in 2020 to $1,444,977 in 2021. The $982,935 increase in cost of revenues for the three months ended December 31, 2021, from 2020 was primarily as a result of increased usage of royalty content and recognition of higher fixed-fee content licensing costs stemming from the execution of additional content licensing contracts in 2021. In addition, 2021 included equipment, fulfillment, and installation costs relating to our Loop Players that had yet not been introduced in 2020.
30
Total operating expenses
Operating expenses increased by $482,583 in 2021 due to the combined effect of various expenses related to increased revenue. Share-based compensation and selling, general, and administrative costs (excluding share-based compensation) increased quarter over quarter by $923,153 and $1,950,229, respectively, largely due to the addition of operations staff and key management personnel, along with expanded marketing campaigns to support the growth of the OOH strategy and the new Loop Players. These increases in 2021 costs were offset by impairment costs recognized in 2020 in amount of $2,390,799 relating to the acquisition of EON.
Other income and expenses
Other income and expenses decreased by 122% or $478,888 from 2020 net expense (largely interest expense) quarter over quarter primarily due to the recognition of gain on the extinguishment of debt related to PPP loans and change in the fair value of derivatives in 2021 of $490,051 and $98,745, respectively in 2021. These gains were partially offset by higher interest expense of $108,212 in 2021.
EBITDA
We believe that the presentation of EBITDA and Adjusted EBITDA, financial measures that are not part of U.S. Generally Accepted Accounting Principles, or U.S.GAAP, provides investors with additional information about our financial results. EBITDA and Adjusted EBITDA are important supplemental measures used by our board of directors and management to evaluate our operating performance from period-to-period on a consistent basis and as a measure for planning and forecasting overall expectations and for evaluating actual results against such expectations.
We define EBITDA as earnings before interest expense (income), income tax (expense)/benefit, depreciation and amortization.
We define Adjusted EBITDA as earnings before interest expense (income), income tax (expense)/benefit, depreciation and amortization, adjusted for stock-based compensation and other non-recurring income and expenses, if any.
EBITDA is not measured in accordance with, or an alternative to, measures prepared in accordance with U.S. GAAP. In addition, this non-GAAP measure is not based on any comprehensive set of accounting rules or principles. As a non-GAAP measure, EBITDA has limitations in that it does not reflect all of the amounts associated with our results of operations as determined in accordance with U.S. GAAP. In particular:
| ● | EBITDA does not reflect the amounts we paid in interest expense on our outstanding debt; |
| ● | EBITDA does not reflect the amounts we received in interest income by our investors; |
| ● | EBITDA does not reflect the amounts we received in interest income on our investments; |
| ● | EBITDA does not reflect the amounts we paid in taxes or other components of our tax provision; |
| ● | EBITDA does not include depreciation expense from fixed assets; and |
| ● | EBITDA does not include amortization expense. |
Because of these limitations, you should consider EBITDA alongside other financial performance measures including net income (loss) and our financial results presented in accordance with U.S. GAAP.
The following table provides a reconciliation of net loss to EBITDA for each of the periods indicated:
31
The following table provides a reconciliation of net loss to EBITDA for each of the years indicated:
| Three months ended |
| Three months ended | |||
December 31, | December 31, | |||||
2021 | 2020 | |||||
GAAP net loss | $ | (4,273,995) | $ | (5,676,224) | ||
Adjustments to reconcile to EBITDA: |
|
|
|
| ||
Interest expense |
| 504,117 |
| 395,905 | ||
Interest income |
| (200) |
| (2,996) | ||
Depreciation and Amortization expense* |
| 343,458 |
| 511,429 | ||
Income Tax expense/(benefit) |
| (251) |
| (98,244) | ||
EBITDA | $ | (3,426,369) | $ | (4,673,642) | ||
*Includes amortization of content license assets.
Adjusted EBITDA
Adjusted EBITDA is not in accordance with, or an alternative to, measures prepared in accordance with U.S. GAAP. In addition, this non-GAAP measure is not based on any comprehensive set of accounting rules or principles. As a non-GAAP measure, Adjusted EBITDA has limitations in that it does not reflect all of the amounts associated with our results of operations as determined in accordance with U.S. GAAP. In particular:
| ● | Adjusted EBITDA does not reflect the amounts we paid in interest expense on our outstanding debt; |
| ● | Adjusted EBITDA does not reflect the amounts we paid in taxes or other components of our tax provision; |
| ● | Adjusted EBITDA does not include depreciation expense from fixed assets; |
| ● | Adjusted EBITDA does not include amortization expense; |
| ● | Adjusted EBITDA does not include the impact of stock-based compensation; and |
| ● | Adjusted EBITDA does not include the impact of non-recurring income and expenses. |
Because of these limitations, you should consider Adjusted EBITDA alongside other financial performance measures including net income (loss) and our financial results presented in accordance with U.S. GAAP.
32
The following table provides a reconciliation of net loss to Adjusted EBITDA for each of the periods indicated:
| Three months ended |
| Three months ended | |||
December 31, | December 31, | |||||
2021 | 2020 | |||||
GAAP net loss | $ | (4,273,995) | $ | (5,676,244) | ||
Adjustments to reconcile to Adjusted EBITDA: |
|
|
|
| ||
Interest expense |
| 504,117 |
| 395,905 | ||
Interest income |
| (200) |
| (2,996) | ||
Depreciation and Amortization expense * |
| 343,458 |
| 511,429 | ||
Income tax expense (benefit) |
| 251 |
| 98,244 | ||
Stock-based compensation |
| 1,549,406 |
| 626,253 | ||
Impairment of intangible assets |
| — |
| 2,390,799 | ||
Gain on extinguishment of debt |
| (490,051) |
| (13,900) | ||
Loss on settlement of obligation |
| — |
| 15,000 | ||
Change in fair value of derivative |
| (98,745) |
| — | ||
Adjusted EBITDA | $ | (2,465,759) | $ | (1,655,490) | ||
*Includes amortization content license assets.
Liquidity and Capital Resources
As of December 31, 2021, we had cash of approximately $1,662,098. The following table provides a summary of our net cash flows from operating, investing, and financing activities.
Three months ended | Three months ended | |||||
December 31, | December 31, | |||||
| 2021 |
| 2020 | |||
Net cash used in operating activities | $ | (3,477,763) | $ | (2,327,034) | ||
Net cash used in investing activities |
| — |
| (745,771) | ||
Net cash provided by financing activities |
| 977,313 |
| 1,939,044 | ||
Change in cash |
| (2,500,450) |
| (1,133,761) | ||
Cash, beginning of period |
| 4,162,548 |
| 1,971,923 | ||
Cash, end of period | $ | 1,662,098 | $ | 838,162 | ||
We have historically sought and continue to seek financing from private sources to implement our business plans. To satisfy our financial commitments, we have historically relied on private party financing, but that has inherent risks in terms of availability and adequacy of funding.
For the next twelve months, we anticipate that we will need to supplement our cash from revenues with additional cash raised from equity investment or debt transactions to ensure that we will have adequate cash to support our minimum operating cash requirements and thus to continue as a going concern.
There can be no guarantee or assurance that we can raise adequate capital from outside sources. If we are unable to raise funds when required or on acceptable terms, we may have to significantly reduce, or discontinue our operations.
Net cash used in operating activities
Net cash flows used in operating activities for the three months ended December 31, 2021, were $3,477,763 primarily due to the net loss of $4,273,995 offset by amortization of debt discount of $358,248, depreciation and amortization of $32,403, amortization of license contract assets of $311,055, amortization of right-of-use assets of $38,555, stock-based compensation expense of $1,549,406, write off of $20,000, gain on extinguishment of debt of $490,051, change in fair value of derivatives of $98,745 and net decrease in operating assets and liabilities of $924,639.
33
Net cash flows used in operating activities for the three months ended December 31, 2020, were $2,327,034 primarily due to the net loss of $5,676,224 offset by amortization of debt discount of $183,533, depreciation and amortization expense of $338,260, amortization of license contract assets of $173,169, amortization of right-of-use assets of $34,860, stock-based compensation expense of $134,253, warrants issued for consulting services of $492,000, write off of $62,154, impairment of intangible assets of $2,390,799, net loss on settlement of obligations of $1,100 and net decrease in operating assets and liabilities of $460,938.
Net cash used in investing activities
Net cash flows used in investing activities for the three months ended December 31, 2021, was $0 as compared to $745,711 primarily due to the cash portion of the acquisition of EON Media Group offset by equipment purchase of $2,752 and collections of note receivable of $1,477 for the same comparable period in 2020.
Net cash flow from financing activities
Net cash provided by financing activities for the three months ended December 31, 2021, was $977,313 due to receipt of proceeds of $1,250,000 stock subscription offset by $272,687 repayment of a stockholder’s loan. Net cash provided by financing activities for the three months ended December 31, 2020, was $1,939,044 primarily due to $880,000 of cash proceeds received from issuance of common stock, cash proceeds from issuance of convertible debt of $750,000, cash proceeds of $350,000 received from issuance of common stock subscriptions, offset by repayment of stockholder loans of $40,956.
As a result of the above activities, the Company recorded a net decrease in cash of $2,500,450 for the three months ended December 31, 2021. The Company reported a cash balance of $1,662,098 at December 31, 2021.
Future Capital Requirements
We have generated limited revenue, and as of December 31, 2021, our cash totaled $1,662,098 and we had an accumulated deficit of ($71,116,411). We anticipate that we will continue to incur net losses for the foreseeable future. However, changing circumstances may cause us to expend cash significantly faster than we currently anticipate, and we may need to spend more cash than currently expected because of circumstances beyond our control.
Historically, our principal sources of cash have included proceeds from the issuance of common and preferred equity and proceeds from the issuance of debt. Our principal uses of cash have included cash used in operations, payments for license rights and payments relating to purchases of property and equipment. We expect that the principal uses of cash in the future will be for continuing operations, and general working capital requirements. We expect that as our operations continue to grow, we will need to raise additional capital to sustain operations and growth.
Proposed Equity Offering filed on S-1
On January 28, 2022, we filed a Form S-1 Registration Statement of Securities under the Securities Act of 1933. We are offering shares of our common stock, which is currently quoted on the Pink Open Market operated by OTC Markets Group Inc. under the symbol “LPTV.” The last reported sale price of our common stock on January 27, 2022, was $2.60 per share.
Currently, there is a very limited market for our common stock. We have applied to list our common stock on the Nasdaq Capital Market under the symbol “LPTV.” There is no assurance that our listing application will be approved by Nasdaq or, if successful, that an active trading market for our common stock will develop or be sustained. If we are unable to list our common stock on the Nasdaq Capital Market, we will not consummate this offering.
We are a “smaller reporting company” under applicable Securities and Exchange Commission rules and are subject to reduced public company reporting requirements for the prospectus and future filings.
34
Going Concern
The accompanying unaudited condensed financial statements have been prepared on a going concern basis. For the three months ended December 31, 2021, we had a net loss of $4,273,995, had net cash used in operating activities of $3,477,763, had working capital of $(1,316,821), and accumulated deficit of $(71,116,411). These matters raise substantial doubt about our ability to continue as a going concern for a period of one year from the date of this filing. Our ability to continue as a going concern is dependent upon our ability to obtain the necessary financing to meet our obligations and repay our liabilities arising from normal business operations when they come due, to fund possible future acquisitions, and to generate profitable operations in the future. Management plans to provide for our capital requirements by continuing to issue additional equity and debt securities. The outcome of these matters cannot be predicted at this time and there are no assurances that, if achieved, we will have sufficient funds to execute our business plan or generate positive operating results. The financial statements do not include any adjustments that might result from the outcome of this uncertainty.
Recent Accounting Pronouncements
We adopted no new recent accounting pronouncements.
Item 3.Quantitative and Qualitative Disclosure About Market Risk.
Not required.
Item 4.Controls and Procedures.
(i)Evaluation of Disclosure Controls and Procedures
Our management, with the participation of our Chief Executive Officer (“CEO”) and Chief Financial Officer (“CFO”), evaluated the effectiveness of our disclosure controls and procedures as defined in Rule 13a-15(e) and 15d-15(e) under the Securities Exchange Act of 1934, as amended (the “Exchange Act”), as of December 31, 2021. Our disclosure controls and procedures are designed to provide reasonable assurance that information we are required to disclose in the reports we file or submit under the Exchange Act is accumulated and communicated to our management, including our CEO and CFO, as appropriate to allow timely decisions regarding required disclosures, and is recorded, processed, summarized, and reported within the time periods specified in the SEC’s rules and forms.
Based on this evaluation, and as a result of the material weaknesses described below, our CEO and CFO have concluded that our disclosure controls and procedures were not effective at the reasonable assurance level as of December 31, 2021. Notwithstanding the material weaknesses that were identified and continued to exist at December 31, 2021, management believes that the financial statements included in this report present fairly in all material respects our financial position, results of operations and cash flows for the period presented.
Material Weaknesses and Management’s Remediation Plan
A material weakness is a deficiency, or a combination of deficiencies, within the meaning of Public Company Accounting Oversight Board (“PCAOB”) Auditing Standard AS 2201, in internal control over financial reporting, such that there is a reasonable possibility that a material misstatement of our annual or interim financial statements will not be prevented or detected on a timely basis.
Internal control over financial reporting is a process designed to provide reasonable assurance regarding the reliability of financial reporting and the preparation of financial statements in accordance with US GAAP. The following material weaknesses in our internal control over financial reporting were identified in the normal course and continued to exist as of December 31, 2021:
We failed to maintain an effective control environment due to the following:
35
| ● | Our management and governance had insufficient oversight of the design and operating effectiveness of the Company’s disclosure controls and internal controls over financial reporting; |
| ● | We failed to maintain effective controls over the period-end financial reporting process, including controls with respect to preparation and disclosure of provision for income taxes, valuation and presentation of asset acquisition, content assets and liabilities, and investments; and |
| ● | We failed to maintain effective controls over journal entries, both recurring and nonrecurring, and account reconciliations and did not maintain proper segregation of duties. Journal entries were not always accompanied by sufficient supporting documentation and were not adequately reviewed and approved for validity, completeness and accuracy. In most instances, persons responsible for reviewing journal entries and account reconciliations for validity, completeness and accuracy were also responsible for preparation. |
Management’s Remediation Initiatives
We have concluded that these material weaknesses arose because, as previously a private company, we did not have the necessary business processes, systems, personnel, and related internal controls. We began to undertake measures to address material weaknesses in our internal controls. We will continue to take steps to remediate these material weaknesses.
We will strive to ensure that a proper, consistent tone is communicated throughout the organization, which emphasizes the expectation that previously existing deficiencies will be rectified through implementation of processes and controls to ensure strict compliance with accounting principles generally accepted in the United States and regulatory requirements.
We have retained a third–party consulting firm that specializes in internal audit work, and more specifically internal controls work. This firm will assist management with our risk assessment of internal control over financial reporting as well as documentation and testing of our internal control structure and evaluation of material weaknesses.
With oversight from the Audit Committee, management will design and implement remediation measures to address the material weaknesses described above and enhance our internal control over financial reporting.
There was a change in our internal control over financial reporting (as such term is defined in Exchange Act Rule 13a-15(f)) that occurred during our most recent quarter that has materially affected or is reasonably likely to materially affect, our internal control over financial reporting.
(ii)Changes in Internal Controls over Financial Reporting
Other than described above, there have not been any changes in our internal control over financial reporting (as such term is defined in Exchange Act Rule 13a).
PART II — OTHER INFORMATION
Item 1.Legal Proceedings
We are currently not involved in any litigation that we believe could have a material adverse effect on our financial condition or results of operations. There is no action, suit, proceeding, inquiry or investigation before or by any court, public board, government agency, self-regulatory organization or body pending or, to the knowledge of our executive officers, threatened against or affecting us, or our common stock, in which an adverse decision could have a material adverse effect.
36
Item 1A. Risk Factors
There have been no material changes to the factors disclosed in Item 1A. Risk Factors in our Annual Report on Form 10-KT for the year ended September 30, 2021.
Item 2.Unregistered Sales of Equity Securities and Use of Proceeds.
For the three months ended December 31, 2021, we sold and issued an aggregate of 0 shares of our common stock.
Item 3.Defaults Upon Senior Securities.
There were no material defaults regarding payments of principal and interest that exceeded 5% of our total assets.
Item 4.Mine Safety Disclosure.
Not applicable.
Item 5.Other Information.
None.
Item 6. Exhibits
Exhibit |
| Exhibit Description |
|
|
|
| ||
|
|
|
| ||
|
|
|
| Certification of Chief Executive Officer pursuant to 18 U.S.C. Section 1350 | |
|
|
|
| Certification of Chief Financial Officer pursuant to 18 U.S.C. Section 1350 | |
37
101.INS | XBRL Instance Document -the instance document does not appear in the Interactive Data File because its XBRL tags are embedded within the Inline XBRL document | |
101.SCH | XBRL Taxonomy Extension Schema | |
101.CAL | XBRL Taxonomy Extension Calculation Linkbase | |
101.DEF | XBRL Taxonomy Extension Definition Linkbase | |
101.LAB | XBRL Taxonomy Extension Label Linkbase | |
101.PRE | XBRL Taxonomy Extension Presentation Linkbase | |
104 | Cover Page Interactive Data File (formatted as inline XBRL and contained in Exhibit 101) |
38
Pursuant to the requirements of the Securities Act of 1934, as amended, the registrant has duly caused this quarterly report to be signed on its behalf by the undersigned thereunto duly authorized on February 14, 2022.
Loop Media, Inc., a Nevada corporation | ||
(Registrant) | ||
By: | /s/ Jon Niermann | |
Jon Niermann | ||
Chief Executive Officer | ||
(Principal Executive Officer) | ||
By: | /s/ Neil Watanabe | |
Neil Watanabe | ||
Chief Financial Officer | ||
(Principal Financial and Accounting Officer) | ||
39