UNITED STATES
SECURITIES AND EXCHANGE COMMISSION
Washington, D.C. 20549
10-KT
Amendment No. 1
ANNUAL REPORT PURSUANT TO SECTION 13 OR 15(d) OF THE SECURITIES EXCHANGE ACT OF 1934 |
For the year ended
OR
TRANSITION REPORT PURSUANT TO SECTION 13 OR 15(d) OF THE SECURITIES EXCHANGE ACT OF 1934 |
For the transition period from
Commission File Number:
(Exact name of registrant as specified in its charter)
(State or other jurisdiction of incorporation) | (I.R.S Employer Identification No.) |
(Address of principal executive offices) (Zip Code)
(
(Registrant’s telephone number, including area code)
Securities registered pursuant to Section 12(b) of the Act:
None
Securities registered pursuant to section 12(g) of the Act:
(Title of class)
Indicate by check mark if the registrant is a well-known seasoned issuer, as defined in Rule 405 of the Securities Act. ☐ Yes ☒
Indicate by check mark if the registrant is not required to file reports pursuant to Section 13 or Section 15(d) of the Act. ☐ Yes ☒
Indicate by check mark whether the registrant (1) has filed all reports required to be filed by Section 13 or 15(d) of the Securities Exchange Act of 1934 during the preceding 12 months (or for such shorter period that the registrant was required to file such reports), and (2) has been subject to such filing requirements for the past 90 days. ☒
Indicate by check mark whether the registrant has submitted electronically every Interactive Data File required to be submitted pursuant to Rule 405 of Regulation S-T (§ 232.405 of this chapter) during the preceding 12 months (or for such shorter period that the registrant was required to submit such files). ☒
Indicate by check mark whether the registrant is a large accelerated filer, an accelerated filer, a non-accelerated filer, a smaller reporting company, or an emerging growth company. See the definitions of “large accelerated filer,” “accelerated filer,” “smaller reporting company,” and “emerging growth company” in Rule 12b-2 of the Exchange Act.
Large accelerated filer ☐ | Accelerated filer ☐ |
Smaller reporting company | |
Emerging growth company |
If an emerging growth company, indicate by check mark if the registrant has elected not to use the extended transition period for complying with any new or revised financial accounting standards provided pursuant to Section 13(a) of the Exchange Act. ☐
Indicate by check mark whether the registrant has filed a report on and attestation to its management’s assessment of the effectiveness of its internal control over financial reporting under Section 404(b) of the Sarbanes-Oxley Act (15 U.S.C. 7262(b)) by the registered public accounting firm that prepared or issued its audit report.
Indicate by check mark whether the registrant is a shell company (as defined in Rule 12b-2 of the Act).
The aggregate market value of the voting and non-voting common stock held by non-affiliates computed by reference to the price at which the common stock was last sold, or the average bid and asked price of such common stock, as of March 31, 2021, was $
As of December 27, 2021, the registrant had
EXPLANATORY NOTE
This Amendment No. 1 (“Amendment No. 1”) to the Transition Report on Form 10-KT of Loop Media, Inc., (the “Company”) for the transition period from January 1, 2021 to September 30, 2021, as filed with the Securities and Exchange Commission (the “SEC”) on January 10, 2022 (the “2021 Transition Report”), is being filed solely to replace the Reports of Independent Registered Public Accounting Firm included in the 2021 Transition Report which inadvertently omitted certain paragraphs.
Except as described in this Explanatory Note, this Amendment No. 1 does not modify, amend, or update any of the financial information or any other information set forth in the 2021 Transition Report.
3
TABLE OF CONTENTS
4
FORWARD-LOOKING STATEMENTS
Except for historical information, this report contains forward-looking statements within the meaning of Section 27A of the Securities Act of 1933, as amended (the “Securities Act”) and Section 21E of the Securities Exchange Act of 1934, as amended (the “Exchange Act”). Such forward-looking statements include, among others, those statements including the words “believes”, “anticipates”, “expects”, “intends”, “estimates”, “plans” and words of similar import. Such forward-looking statements involve known and unknown risks, uncertainties and other factors that may cause our actual results, performance or achievements, or industry results, to be materially different from any future results, performance or achievements expressed or implied by such forward-looking statements.
Forward-looking statements are based on our current expectations and assumptions regarding our business, potential target businesses, the economy and other future conditions. Because forward-looking statements relate to the future, by their nature, they are subject to inherent uncertainties, risks and changes in circumstances that are difficult to predict. Our actual results may differ materially from those contemplated by the forward-looking statements. We caution you therefore that you should not rely on any of these forward-looking statements as statements of historical fact or as guarantees or assurances of future performance. You should understand that many important factors, in addition to those discussed or incorporated by reference in this report, could cause our results to differ materially from those expressed in the forward-looking statements. Important factors that could cause actual results to differ materially from those in the forward-looking statements include changes in local, regional, national, or global political, economic, business, competitive, market (supply and demand) and regulatory conditions and the following:
| ● | Our ability to raise capital when needed and on acceptable terms and conditions; |
| ● | Our ability to attract and retain management with experience in digital media including digital video music streaming, and similar emerging technologies; |
| ● | Our ability to negotiate, finalize and maintain economically feasible agreements with the major and independent music labels, publishers and performance rights organizations; |
| ● | Our expectations regarding market acceptance of our products in general, and our ability to penetrate the digital video music streaming market in particular; |
| ● | The scope, validity and enforceability of our and third-party intellectual property rights; |
| ● | Our ability to comply with governmental regulation; |
| ● | The intensity of competition; |
| ● | The effects of the ongoing pandemic caused by the spread of the novel coronavirus COVID-19 (“COVID-19”) and our business customers ability to service their customers in out of home venues, especially considering government-imposed business shutdowns and capacity limitations; |
| ● | Changes in the political and regulatory environment and in business and fiscal conditions in the United States and overseas; |
| ● | Our ability to attract prospective users and to retain existing users; |
| ● | Our dependence upon third-party licenses for sound recordings and musical compositions; |
| ● | Our lack of control over the providers of our content and their effect on our access to music and other content; |
| ● | Our ability to comply with the many complex license agreements to which we are a party; |
| ● | Our ability to accurately estimate the amounts payable under our license agreements; |
5
| ● | The limitations on our operating flexibility due to the minimum guarantees required under certain of our license agreements; |
| ● | Our ability to obtain accurate and comprehensive information about music compositions in order to obtain necessary licenses or perform obligations under our existing license agreements; |
| ● | Potential breaches in security of systems that house proprietary data. |
| ● | Assertions by third parties of infringement or other violations by us of their intellectual property rights; |
| ● | Competition for users and user listening time; |
| ● | Our ability to generate sufficient revenue to be profitable or to generate positive cash flow on a sustained basis; |
| ● | Our ability to accurately estimate our user metrics; |
| ● | Risks associated with manipulation of stream counts and user accounts and unauthorized access to our services; |
| ● | Changes in legislation or governmental regulations affecting us; |
| ● | Ability to hire and retain key personnel; |
| ● | Our ability to maintain, protect and enhance our brand; |
| ● | Risks associated with our international expansion, including difficulties obtaining rights to stream music on favorable terms; |
| ● | Risks relating to the acquisition, investment and disposition of companies or technologies; |
| ● | Dilution resulting from additional share issuances; |
| ● | Tax-related risks; |
| ● | The concentration of voting power among our founders who have and will continue to have substantial control over our business; |
| ● | International, national, or local economic, social or political conditions, and |
| ● | Risks associated with accounting estimates, currency fluctuations and foreign exchange controls. |
Other sections of this report describe additional risk factors that could adversely impact our business and financial performance. Moreover, we operate in an evolving environment. New risk factors and uncertainties emerge from time to time, and it is not possible for our management to predict all risk factors and uncertainties, nor are we able to assess the impact of all of these risk factors on our business or the extent to which any risk factor, or combination of risk factors, may cause actual results to differ materially from those contained in any forward-looking statements. These risks and others described under the section “Risk Factors” below are not exhaustive.
Given these uncertainties, readers of this Transition Report on Form 10-KT (“Transition Report”) are cautioned not to place undue reliance on such forward-looking statements. We disclaim any obligation to update any such factors or to publicly announce the result of any revisions to any of the forward-looking statements contained herein to reflect future events or developments.
6
PART I
ITEM 1. BUSINESS.
Overview
We are a multichannel digital video platform media company that uses marketing technology, or “MarTech,” to generate our revenue and offer our services. Our technology and vast library of videos and licensed content enables us to curate and deliver short-form videos to our out-of-home (“OOH”) dining, hospitality, retail and other customers to enable them to inform, entertain and engage their customers. Our technology provides OOH customers and third-party advertisers with a targeted marketing and promotional tool for their products and services and allows us to measure the number of potential viewers of such advertising and promotional materials. In addition to providing services to OOH venue operators, we provide our services direct to consumers (“D2C”) in their homes and on their mobile devices.
We offer self-curated music video content licensed from major and independent record labels, as well as movie, television and video game trailers, kid-friendly videos, viral videos, drone footage, news headlines, and lifestyle and atmospheric channels. We believe we are the only service in the United States that has OOH and D2C licenses with all three major music labels, Universal Music Group (“Universal”), Sony Music Entertainment (“Sony”) and Warner Music Group (“Warner” and collectively with Universal and Sony, the “Music Labels”). These licenses allow us to provide music video content in both the OOH and D2C markets. Our OOH services are complimented by our mobile app (the “Loop App”), which allows users to follow each other, share their locations and playlists, view activity, and signal support for a music video.
We curate content into playlists for OOH locations and into streaming channels for delivery to our over-the-top (“OTT”) platform customers and our mobile application users. Our digital platform service seeks to surround and engage consumers with a diverse offering of video content on their chosen digital screen wherever they are located. Our services include both an ad-supported service, which offers content on a free or unpaid advertising supported basis, and a premium service, which offers content on a paid subscription basis. We deliver our service to OOH locations primarily through our proprietary Loop Media-designed “small-box” streaming Android media player (the “Loop Player”) and we deliver our services direct to consumers primarily through our fully functional and operational Loop App and across OTT streaming platforms on connected TVs (“CTVs”).
Industry
Consumer Adoption of Streaming Services
In recent years, the video streaming services industry experienced, and is expected to continue to experience, significant growth, as entertainment is delivered to consumers across an increasing array of digital platforms and services. According to data (the “Statista Data”) from Statista, Inc. (“Statista”), revenue from the transmission and sale of video content over the internet (“VCOI”) is projected to reach $76.7 billion in 2021 and rise to $113.9 billion by 2025, a 10.4% compounded annualized growth rate (“CAGR”), with free (ad-supported) OTT users expected to increase from 213.2 million users in 2020 to a projected 225.4 million users in 2025. According to the Statista Data, the largest revenue segment for VCOI is revenue derived from OTT video advertising (all advertising-financed moving image content, from premium to user-generated), with revenue of $34.3 billion in 2020, and projected revenue of $40.6 billion in 2021, $46.5 billion in 2022 and $63.3 billion in 2025, representing a CAGR of 13.0% over that period. According to Activate (based on information from Statista), the number of connected TV households (households for which at least one person of any age used the internet through a CTV at least once per month) in the United States is expected to increase from 85 million in 2017 to 113 million in 2024.
Digital-Out-of-Home Advertising
In 2020, we primarily began using a free, ad-supported revenue model for our OOH business and believe our ad-supported services will be the primary driver of our revenue growth as demand for digital-out-of-home advertising is expected to grow. According to Statista Data, overall advertising spend in the United States was $268.86 billion in 2011
7
and is expected to grow to $294.09 billion in 2021 and $364.38 billion in 2025. 80% of digital advertising (in 2020) was delivered to media outlets through programmatic advertising. Programmatic advertising is a system that automates the processes and transactions involved with purchasing and dynamically placing ads on websites, apps or other digital delivery systems. Programmatic advertising makes it possible to purchase and place ads, including targeted advertising content, in seconds. According to the Statista Data, ad spending in the OOH space in the United States was $6.49 billion in 2020 and is expected to increase to $7.21 billion in 2021 and $9.00 billion in 2025.
Our Revenue Model
Our ad-supported and subscription-based services are separate offerings but work together to support our business. Given the expected growth in the digital OOH advertising market, coupled with the preferable economics to the Company of an ad-supported business model, we encourage our customers to choose our ad-supported services over our subscription services. While our ad-supported services are generally associated with higher margins, we provide a subscription service for OOH customers that are seeking an ad-free content offering.
MarTech
MarTech, the intersection of marketing and technology, fuels our growth and leverages data and analytics to expand our points of distribution and advertising revenue.
Distribution. Our current customer acquisition strategy is focused on marketing our Loop Player to business through social media and other online mediums. We seek to optimize our customer acquisition and the distribution of our Loop Players by analyzing various data, including our return on marketing investments. When analyzing the success of our marketing investments, we examine the number of sales leads obtained from online platforms and the conversion of leads into high quality customers. We continuously analyze the engagement with, and success of, our creative advertising content and modify our messaging to improve customer acquisition.
Advertising Revenue. We intend to increase revenue by leading with programmatic advertising, an automated measurement process that manages the sales of our advertising inventory. Today, most digital advertising is programmatic advertising, with digital OOH advertising comprising a small portion of the overall market. While we strive to establish direct advertising deals with advertisers, a significant part of our current advertising revenue is purposely secured through programmatic advertising. Our yield optimization strategies look to leverage data analytic and other techniques to maximize the value of our digital advertising inventory. We intend to optimize the combination of our ad impressions, cost per impression and the percentage of our ad inventory filled by advertisers, while balancing our customers’ experience
8
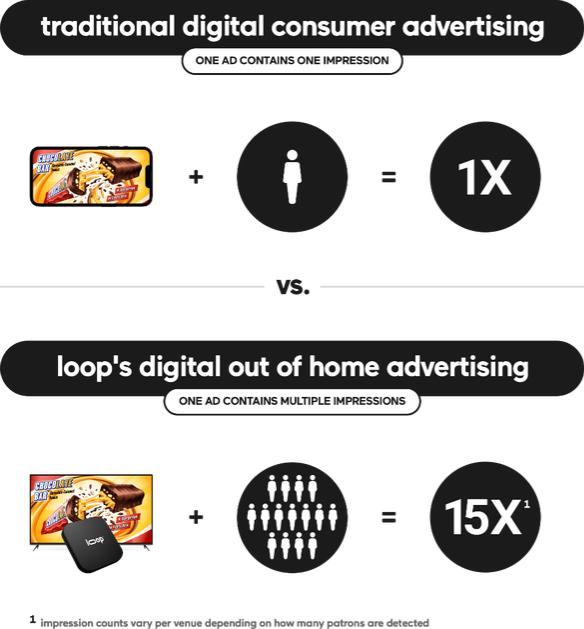
by limiting the number of ads delivered during any given period. Our Loop Player is designed to allow us to multiply OOH revenue in certain locations, as outlined below:
9
Loop Player
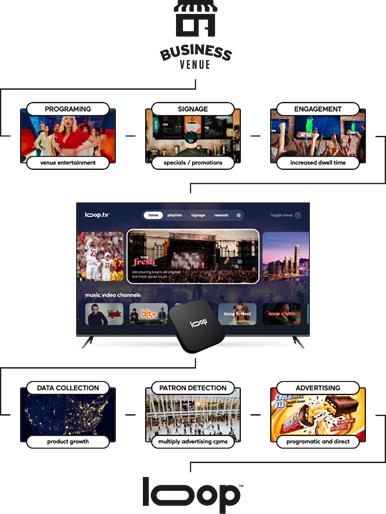
The Loop Player is at the heart of our revenue model and its technology enables us to communicate and interact with OOH locations, advertisers, and OOH customers:
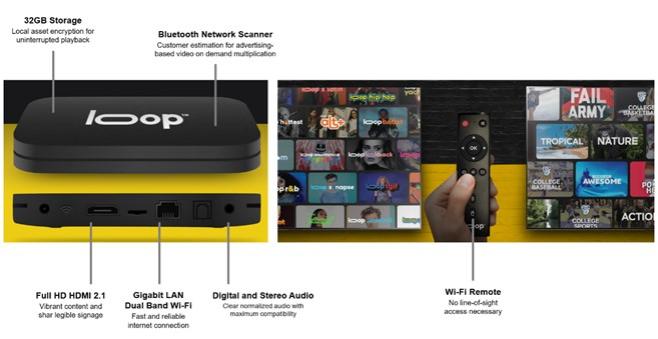
| ● | OOH Locations. The Loop Player allows OOH customers to program their in-store monitors and audio systems to schedule playlists depending on the time of day, promote their products or services through digital signage and deliver company-wide messages to staff in back-office locations. Business owners can filter content based on ratings or explicit language and can control the genres of videos in their programs. The Loop Player caches and encrypts our content, thereby supplying uninterrupted play for up to 12 hours in the event of an internet disruption. |
| ● | Advertising and Content Partners. Our Loop Player works with our technology, software and servers to determine the number of ad impressions available for programmatic advertising, which can be filled in real-time, seconds before ads are played. Our Loop Player delivers content and advertising to venues and our technology allows us to record and report video content played (for reporting to content providers) and advertising content played (for reporting to our advertising demand partners and advertisers). In particular, our technology allows us to track when, where and how long content is played, and measure approximately how many consumers were in position to view the content or advertisement. The Loop Player’s Wi-Fi and |
10
| Bluetooth capabilities allow us to determine the number of potential viewers at a given location, which can provide us with a revenue multiplier, as we are able to increase advertising revenue at high-volume locations. This “multiplier effect” is possible due to the Loop Player’s ability to detect, using Bluetooth and Wi-Fi technology, the number of consumer mobile devices within reach of a Loop Player in an OOH location which provides advertisers with a proxy for the number of potential viewers of a particular ad at any given time. |
| ● | OOH Customers. We are seeking to further develop the interactivity between the Loop Player and the customers in OOH venues. This may take different forms, such as offering a simple thumbs up or thumbs down function, displaying the number of customer votes for a given piece of content, and downloading of menus from the screens and other functions. This will require further development of our mobile application in the future. |
| ● | Loop Media. We are able to consistently monitor the preferences of the customers of our OOH customers and venue operators through our Loop Player. Our Loop Player allows us to collect specific information and data on content played, views, location, and location type, enabling us to effectively measure demand. These capabilities allow us to make informed decisions around which type of content to acquire or develop, as well as identify new market opportunities. |
11
Our Platform
The following table sets forth our customer targets, delivery method, preferred revenue model and the associated content for our services:
CUSTOMER | DELIVERY METHOD | PREFERRED REVENUE MODEL | CONTENT |
OOH Venue | Loop Player | Ad-supported service | ● All forms of content, including music video and other content ● Curated playlists and channels |
Consumer Connected TVs | OTT Platforms and Loop App | Ad-supported service | ● Primarily music videos ● Not all of our music content can be streamed ● Non-music video content is currently limited, but we intend to expand this category |
Consumer Mobile Devices | Loop App | Subscription service | ● Music videos and kid-friendly content only ● Curated playlists and channels ● Videos on demand for subscription service |
OOH Locations
The foundation of our business model is built around the OOH experience, with a focus on distributing licensed music videos to public-facing businesses and venues. Our OOH offering has supported hospitality and retail businesses for over 20 years, originally through ScreenPlay, which we acquired in 2019. Since the acquisition of ScreenPlay, we have primarily focused on acquiring OOH customers throughout the United States.
Most locations deliver visual content to their customers by use of cable TV boxes and computer-based audio video equipment, which requires significant investment and cost to the venue operator. Capital investment in equipment has historically been a barrier for many businesses to provide visual entertainment to their customers. Unlike consumers in their homes, who have been more willing in recent years to invest in CTVs and streaming services, businesses generally have been slower in adopting lower cost streaming options.
To gain greater access, and expand our business with, OOH venue operators, we developed our proprietary Loop Player. The Loop Player is easy to set up and allows content to be streamed on multiple television sets. We believe our Loop Player and free, ad-supported service has significantly reduced the cost of specialty equipment and visual entertainment for venue operators.
The Loop Player was introduced in a limited rollout in early 2020, with a more formal rollout during the fourth quarter of 2020. We believe the COVID-19 pandemic, which caused many businesses to shut down or reduce capacity, has accelerated business owners’ demand for CTVs and streaming services to reduce their costs. For this reason, we believe the introduction of our Loop Player, coupled with our switch to a free ad-supported business model has contributed to the growth in 2021 of our OOH business customers. In 2021, our customer base expanded beyond our typical hospitality-based customers to smaller venues, franchisees and venues that service non-hospitality industries, like pet stores, doctors’ offices and other non-traditional venues.
We expect revenue from our OOH ad-supported service to increase to a greater extent than our revenue from our other services. This is partly due to our ongoing efforts to add new OOH locations to our distribution network, which
12
increases the number of Loop Players in the market and, in turn, the number of ad impressions available for advertisers to fill with paid advertisements and sponsorships. In addition, our OOH ad-supported service using the Loop Player allows us, in certain circumstances, to present a greater number of ad impressions per OOH location to an advertiser than would typically be associated with a single OOH location. This “multiplier effect” is possible due to the Loop Player’s ability to detect, using Bluetooth and WiFi technology, the number of consumer mobile devices within reach of a Loop Player in an OOH location, which provides advertisers with a proxy for the number of potential viewers of a particular ad at any given time. This contrasts with other OOH technology that is not capable of providing data on the number of persons in an OOH location and in which advertisers pay for one ad impression per ad in an OOH location, regardless of the number of potential viewers in that location. This also contrasts with our D2C services where advertisements are considered to be viewed by one person on their individual mobile device or on a CTV in their home.
D2C
Consumer Connected TVs
Our OTT business provides our OTT platform customers, such as Roku, TiVo, and DistroTV, with music videos and other video content, providing their subscribers and customers with access to certain videos in our library. Our service to OTT platform providers has been primarily ad-supported as many of the providers run a free advertising supported television, or FAST, business model for channels on their services. Not all of our music video content is available to our OTT customers. We also have a consumer CTV app that can be downloaded on CTVs and on which consumers can view certain of our content. Almost all of the viewers of our content on CTVs view our content on our channels delivered through OTT platforms rather than on our CTV consumer app.
Consumer Mobile Devices
We developed the Loop App for the distribution of our music videos and kid-friendly content. The Loop App allows our users to directly interact with our channels and playlists on their smart phones, tablets, and other digital devices, providing advertisers with additional mediums to reach consumers. Our premium users are provided enhanced features to search for titles of music videos and artists, request music videos and create personalized playlists. Additionally, through our subscription service, we provide social features that allow users to follow each other, share their locations and playlists, view activity, signal support for a particular music video, and listen to other users “Loops.” We initially launched the Loop App in mid-2020; however, we have not promoted or advertised it in any meaningful way. As we continue to grow our OOH business and distribute additional Loop Players, we believe the Loop App will enhance our interactivity with businesses and their customers, and in turn, influence the content we develop and acquire.
Our Competitive Strengths
Diversified Content Library, including Music Videos
We believe our music video library is one of the largest in the world and gives us an advantage over many of our competitors. Our music video library contains videos dating back to the 1950s, appealing to generations of music-lovers, with the newest videos directly obtained from the Music Labels. Older music video libraries are more difficult to obtain, as there is generally no central database from which to acquire such videos. Additionally, the individual music labels who have rights over portions of such videos do not easily and readily provide them to those seeking to acquire them. We have strategically secured access to our music video content through our license agreements with the individual Music Labels. We believe we are the only service in the United States who has licenses with all three major Music Labels to provide music video content in both the OOH and D2C markets.
Efficient Content Curation
We believe we are able to produce engaging video content by curating our own and third party-content at relatively low production cost. We do not currently produce a meaningful amount of original content, which can be expensive and time consuming. In contrast to many streaming platforms, we curate existing content from our video library and content licensed from third parties. The curation of our content from our owned and leased libraries eliminates the
13
costly and lengthy production process associated with creating original content. Therefore, we are able to consistently innovate, update, and enhance our content offerings in a cost-effective and timely manner. We believe we were able to launch more channels than any other media company on OTT platforms during 2020.
National Distribution and Reach
We distribute our services across thousands of OOH locations, audio and video streaming platforms, and mobile and connected TV applications. We had 5,791 quarterly active users (“QAU”) across North America for the quarter ended September 30, 2021, and our channels are available to millions of consumers on OTT platforms and are currently accessible in over 400,000 hotel rooms, serving both the OOH and D2C markets, respectively. We have recently hired salespeople to engage in direct marketing for our OOH business across various regions, including the East Coast, West Coast, South. See “Management’s Discussion and Analysis of Financial Condition and Results of Operations – Key Performance Indicator” for a description of QAUs.
Technology Based Business Model
All of our key software and the design of our Loop Player and consumer apps has been developed in-house by us. We have built our services and platform with a view to the future, focusing on where we believe the digital OOH and consumer streaming and mobile devices markets are and will be for the foreseeable future. The Loop Player is ideal for OOH location operators looking to “cut the cord” from their old business models. This allows our OOH customers to save costs and provides them with a greater ability to customize and schedule content to fit their venues. We use digital marketing technology, or “MarTech,” to generate revenue, market our services and fuel our business. Additionally, we believe we can attract key employees from across geographies as we operate almost entirely remotely in support of our culture of technology and efficiency. Our use of technology in most aspects of our business from marketing, to distribution, content curation, sales, customer service and other areas, allows us to leverage our existing employees as we continue to scale up our business.
Established Foundation Supported by Industry Tailwinds
Our technology stack, ad-supported revenue model and music video library are the backbone of our business. We believe this established foundation places us in a better position than many peers to benefit from any industry tailwinds in the digital OOH advertising market. Because our foundation has been built with a view to where we believe the OOH content delivery and digital marketing trends are headed, we believe we are better positioned than many of our competitors who might have to re-work their technology and revenue models to better align with these trends. We believe our programmatic advertising in the OOH market will support our revenue into the future.
Passionate and Experienced Management Team
Our seasoned management team is founder-led and has more than 100 years of combined media and technology experience. Our executive team has previous experience at some of the most well recognized entertainment companies in the world, including Walt Disney, Universal Music, MTV, VH1, CBS, Sony, Viacom, Time Warner, among others.
Our Growth Strategies
Our growth strategies are focused on monetizing and growing our content library and are guided by the following five pillars:
Increase Marketing of Loop Player. We have found online digital advertising to be a successful customer acquisition strategy and believe there is a direct correlation between digital marketing spend and business demand for the Loop Player. In addition to digital advertising viewed by individual businesses, we also intend to leverage our internal sales team to increase our direct marketing efforts to promote our Loop Player and services to large, national or regional, franchisee or corporate owned businesses.
14
Diversify Customer Base. We believe the introduction of our Loop Player and shift towards an ad-supported service model has contributed to the growth of our OOH customer base and related revenues. Our customer base has expanded beyond our typical hospitality, food and beverage and gym customers, as we have experienced an increase in business engagement from smaller venues, franchisees, and businesses that service other industries. This expansion has given us greater insight into the viewing habits of a diverse customer base and the demand for some of our non-music video content thereby enabling us to develop and curate content that continues to respond to consumer demand.
Expand our Non-Music Video Content. Our music video library is the foundation of our business but, in certain instances, has lower margins due to the licensing fees of the Music Labels and other rights holders. In addition, certain OOH locations are looking for a broader or more targeted content offering than pure music videos. Since the acquisition of ScreenPlay’s music video library in 2019, we have sought to expand our non-music video content through licensing, acquisitions and our own development. Non-music content, in certain instances, provides better economics to us than music video content. For this reason, we seek to expand our non-music offerings, which entails the addition of entertainment, lifestyle, and information channels.
Optimize Advertising Sales and Sponsorships. We aim to optimize our advertising sales by using technology and short-term, third-party consultants, to collect data and employ analytics. Similarly, we plan on continuing to optimize our programmatic revenue through MarTech data and analytics. In conjunction with these efforts, we recently expanded our advertising sales team to focus on advertising sales directly to companies that seek to advertise on our platform and to companies that are interested in providing sponsorship of our content. Through such arrangements, we may receive payments from a company in return for allowing such company to be associated with one of our channels, playlists, other content or company events.
International Expansion. We are exploring international expansion, as we believe the provision of video content in the non-U.S. OOH and D2C markets is underserved. In 2020 we began pursuing these growth initiatives by launching the Loop App in Mexico, and in 2021, we acquired EON Media, which produces a weekly syndicated radio program targeted across Asia. Over time, we plan to be opportunistic exploring ways to potentially expand in Asia, certain countries in South America, Canada and Europe.
Our Content
Content Acquisition
Music Videos. Although we own copies of the music videos that we deliver to our customers, we must secure the rights to stream the video, the sound recordings, and the musical compositions embodied therein (i.e., the musical notes and the lyrics). To do so we enter into license agreements to obtain licenses from rights holders such as record labels, music publishers, performance rights organizations, collecting societies, and other copyright owners or their agents, and pay royalties to such parties or their agents.
We currently have licenses and agreements with multiple parties to distribute our music videos for our consumer customers in the United States, Canada, and Mexico. We also have longstanding limited, non-exclusive licenses to digitally distribute certain music videos and related materials owned or controlled by the three Music Labels to our OOH customers in the United States. In 2020, we entered into agreements with the Music Labels, pursuant to which we were also provided limited, non-exclusive licenses to digitally distribute certain music video recordings and related materials owned or controlled by the Music Labels in connection with our D2C business. We entered into the last of these agreements in December 2020, which ultimately allowed us to provide a more complete offering of music video content to our D2C customers beginning in 2021.
Trailers. Our film, game and TV trailer library is one of our largest video libraries. Similarly, to our music video library, it includes a back catalog of old videos, dating back to the early 1900s. More recent trailers are secured from the relevant production companies, at no cost to us, and are added to our growing library. Our back catalogue of older trailers was obtained with the acquisition of ScreenPlay.
15
Other. In addition to music videos and movie trailers, we have obtained other video content for curation and distribution to our customers. This content includes, college sports highlights, viral videos, atmospheric, travel, and kid-friendly videos.
We continue to explore opportunities to secure other forms of video content to add to our growing content library.
Content Curation
In November 2020, we created a new business division at Loop, called Loop Media Studios (“Loop Studios”), to lead the acquisition, curation, production, and branding of our video content. We believe Loop Studios was instrumental to our success in releasing more channels on OTT platforms for distribution on CTVs in 2021 than any other media company.
Loop Studios works to curate content to create a compelling user experience by, among other things, curating Playlists by genre, mood, or time periods Additionally, Loop Studios creates streaming channels, delivered under our “watch live tv” product feature on our Loop Player and Loop App. We currently have over 80 music video channels for OOH customers, 23 non-music video channels for OOH customers, and 10 music video channels for consumer end-users delivered through the Loop App on CTVs or mobile devices.
Through Loop Studios we seek to produce our own content “in-house” that can be packaged separately or as part of our third-party content offerings, and we plan to deliver this content through our existing and future channels.
Content Distribution
We aim to make our content available virtually anywhere at any time. To achieve this objective, we currently leverage our existing content across thousands of OOH locations, audio and video streaming services and mobile and connected TV apps. More specifically, there are over 5,000 active Loop Players distributed across North America and our channels are available to be viewed by millions of consumers on OTT platforms and in over 400,000 hotel rooms, serving both the OOH and D2C markets, respectively.
License Agreements
In order to stream video content to our users, we generally secure intellectual property rights to such content by obtaining licenses from, and paying royalties or other consideration to, rights holders or their agents. Below is a summary of certain provisions relating to our license agreements for music videos, the musical compositions embodied therein, as well as other non-music video content.
Music Video and A/V Recordings License Agreements with Major and Independent Record Labels
We enter into license agreements to obtain rights to stream music videos, including from the Music Labels. These agreements require us to pay royalties and make minimum guaranteed advanced payments, and they include marketing commitments, advertising inventory and financial and data reporting obligations. Rights to A/V recordings granted pursuant to these agreements is expected to account for the vast majority of our music video use for the foreseeable future. Generally, these license agreements have a short duration and are not automatically renewable. The license agreements also allow for the licensor to terminate the agreement in certain circumstances, including, for example, our failure to timely pay sums due within a certain period, our breach of material terms and certain situations involving a “change of control” of Loop. These agreements generally provide that the licensors have the right to audit us for compliance with the terms of these agreements. Further, they contain “most favored nations” provisions, which require that certain material contract terms be at least as favorable as the terms we have agreed to with any other similarly situated licensor. Our current license agreements with the Music Labels for our OOH business have been in effect (or have been renewed) for several years, and the Music Labels have requested a review and update of those licenses. Although the basic outlines of these licenses are standardized by the licensors and we do not anticipate any issue in the timely renewal of these licenses, the updating of such licenses may increase our license costs associated with such rights, including the percentage of revenue attributable to the record labels and our minimum guaranteed payment obligations. A significant majority of our OOH business relies
16
upon these licenses, and if we fail to maintain and renew these licenses our business, operating results, and financial condition could be materially harmed. With respect to our D2C business, the licenses with the Music Labels are similarly standardized, and although we do not anticipate any issue in the timely renewal of these licenses as needed. Any future updates of such licenses similarly may increase our license costs associated with such rights, including the percentage of revenue attributable to the record labels and our minimum guaranteed payment obligations. See “Risk Factors—Risks Related to Our Business—Minimum guarantees and advances required under certain of our license agreements may limit our operating flexibility and may adversely affect our business, operating results, and financial condition.”
Musical Composition License Agreements
Our business model requires that we also obtain two additional types of licenses with respect to the musical compositions: reproduction and public performance rights. Mechanical licenses are required to distribute recordings written by someone other than the person or entity conducting the distribution. Such licenses ensure that the music publisher, and ultimately the songwriter, receive compensation for use of their intellectual property. A public performance license is an agreement with the owner of a copyrighted musical composition, pursuant to which such copyright owner grants to the licensee permission to reproduce such copyrighted composition in public, online, or on radio. We have obtained direct licenses for mechanical rights with the three largest publishers, who are respective affiliates of each of the Music Labels, for our OOH and D2C businesses. As a general matter, after music licenses are obtained from the Music Labels, their affiliate publishing companies enter into agreements with respect to the mechanical licenses. If our business does not perform as expected or if the rates are modified to be higher than the proposed rates, our music video content acquisition costs could increase, which could negatively harm our business, operating results, and financial condition, hinder our ability to provide interactive features in our services, or cause one or more of our services not to be economically viable due to an increase in content acquisition costs.
In the United States, public performance rights are generally obtained through PROs, which negotiate blanket licenses with copyright users for the public performance of compositions in their repertory, collect royalties under such licenses and distribute those royalties to music publishers and songwriters. We have obtained public performance licenses from, and pay license fees to, the PROs in the United States: ASCAP, BMI, the SESAC, LLC and Global Music Rights, LLC. These agreements impose music usage reporting obligations on Loop and grant audit rights in favor of the PROs. In addition, these agreements typically have one-to-two-year terms, and some have continuous renewal provisions, with either party able to terminate for convenience within 30 to 60 days prior to the end of the applicable term (or commencement of the subsequent term), and are limited to the territory of the United States and its territories and possessions.
License Agreements with Non-Music Video Content
With respect to non-music content, we obtain distribution rights directly from rights holders. We then negotiate licenses directly with individuals or entities in return for providing such licensors with a share of revenue derived from the licensed content distributed by through our services. We are dependent on those who provide the content that appear on our services complying with the term and conditions of our license agreements. However, we cannot guarantee that rights holders or content providers will company with their obligations, and such failure to do so may materially impact our business, operating results, and financial condition.
License Agreement Extensions, Renewals, and Expansions
From time to time, our various license agreements described above expire while we negotiate their renewals. In accordance with industry custom and practice, we may enter into brief (for example, month-, week-, or even days-long) extensions of those agreements or provisional licenses and/or continue to operate on an at will basis as if the license agreement had been extended. It is also possible that such agreements will never be renewed at all, which could be material to our business, financial condition and results of operations. License agreements are generally restrictive as to how the licensed content is accessed, displayed and manipulated, as licensors seek to protect the use of their content. We may from time to time seek expansion of our licenses to provide us with greater functionality of our services as it relates to the relevant content. The inability to expand our licenses, or the lack of renewal, or termination, of one or more of our license agreements, or the renewal of a license agreement on less favorable terms, could have a material adverse effect on our
17
business, financial condition, and results of operations. If any of the above were to occur, our ability to provide any particular content that our customers favor or are seeking would be limited, which would result in those customers going elsewhere. See “Risk Factors—Risks Related to Our Business—We depend upon third-party licenses for substantially all of the content we stream and an adverse change to, loss of, or claim that we do not hold any necessary licenses may materially adversely affect our business, operating results, and financial condition.”
Competition
Our competitive market is made up of a variety of small to large companies, depending upon the area that we are competing in.
In the OOH market, we compete with several small, fragmented companies. Our direct competitors include Atmosphere, Stingray, and Rockbot. We believe that the major competitive factors in the OOH marketplace are price, technology, quality music video content and other entertainment content.
In the OTT market, we compete with a significant number of large and small companies to secure our service on OTT devices and, once on the service, we compete for individual viewers of our product. Our competitors include Vevo, Jukin Media, and Stingray. We believe that the major competitive factors in the OTT marketplace are quality content and revenue share splits.
In the consumer application market, we compete with a large number of audio-only companies for music but very few for music videos. Our direct competitors include Xcite and YouTube Music.
Marketing and Sales
Our sales and marketing efforts are primarily focused on reaching our OOH customers. Historically, our sales cycle from first contact with a potential customer to adoption of our services was relatively long and met with varying degrees of success, as the A/V equipment required to run our service was often considered expensive by many of the venues looking to acquire it. Our sales and marketing efforts historically have depended almost entirely on direct marketing by our internal sales representatives, including multiple contacts, onsite demonstrations of our services and potentially on-site installation and technical support, when needed. The introduction of our Loop Player for OOH venues has enabled us to adopt a digital marketing strategy, in addition to our direct marketing.
Following the introduction of our proprietary Loop Player, our sales and marketing strategy for OOH customers has consisted of a bottom-up and top-down approaches. Our bottom-up approach markets our Loop Player and our OOH business through digital marketing to potential business customers for use at their individual venues. The marketing reaches these businesses through the Internet, mobile devices, social media, search engines and other digital channels. Our digital marketing campaign targets businesses in certain industries that are more likely to use our services and become a customer, as determined by our past experience and by analyzing and identifying leads sourced from our online marketing channels. We are able to mail a physical Loop Player to individual businesses that sign up for our services online upon verification of the business venue. We then utilize our team of customer service personnel, digital prompts, including text messages, and promotional rewards to ensure activation of the Loop Player after receipt by the potential customer. For subscription services, a sales representative will call the potential business customer to better communicate the various subscription services pricing and availability.
Our top-down approach for OOH marketing and sales relies on our internal sales team targeting large, national or regional, franchisee or corporate-owned, businesses, to promote our Loop Player and services in multiple venues controlled by them. We often will obtain a lead for these businesses from individual venues in such business’ network of venue operators and owners. The top-down approach has a longer sales cycle, but often results in a greater reach and distribution of our Loop Player and services, since we are able to enter multiple venues at a single time, once adopted.
Our sales and marketing efforts in our D2C consumer business is more limited and relies on our internal direct marketing and sales team to approach various Smart TV and CTV operators, distributors, and manufacturers. We seek to meet their needs by providing compelling content for their networks and platforms through our Loop App or otherwise.
18
We also seek to cross-promote our OOH and D2C businesses on each respective platform and believe greater penetration of our OOH business will help drive exposure to the public consumers of our D2C products.
Seasonality
We have seen seasonality in our revenue and business related to advertising sales and the distribution of our Loop Player. This seasonality may not be reflected in our results of operations as we experienced overall growth in revenue in recent quarters and expect to continue to do so, which may obscure underlying seasonal trends. The underlying seasonality, nonetheless, may act to slow our revenue growth in any given period.
Our revenues are largely reliant on digital advertising sales. Revenue associated with such sales is dependent on our ability to fill our ad inventory for our OOH locations using our ad-supported services and the price, or CPMs, at which such inventory can be sold. Advertisers usually manage their budgets on a quarterly basis, which results in lower CPMs at the beginning of a quarter and increase at the end of a quarter. The first quarter of a calendar year (which is our second quarter) is traditionally the least profitable quarter in terms of revenue generation for ad publishers (such as us) and the fourth quarter is typically the most profitable for publishers, as companies want their brands and products to be seen in the run up to the holidays season. This generally results in publishers receiving the highest CPMs and the greatest ad demand for their ad impressions during the fourth quarter of a calendar year (our first quarter) and lower CPMs and reduced ad fill rates during the first quarter of a calendar year (our second quarter). We seek to offset the reduction in CPMs and ad fill rates with increased Loop Player distribution and ad impressions across our ad-supported services.
Our customer acquisition cost is largely influenced by the cost of our digital marketing, as a significant portion of our Loop Player distribution is reliant on OOH venues and locations responding to our on-line advertisements. We see a direct correlation between the number of digital advertisements we run and the growth in our on-line customer acquisitions. The cost of the digital ads we run fluctuates from period to period and is generally based upon the overall market CPMs and the market demand for digital ad impressions. We continuously monitor CPMs and ad demand with a view to balancing our desire to grow our distribution of Loop Players and the cost of acquisition associated with such growth. As a result, we generally look to reduce our digital marketing spend during times of peak market demand and highest cost of digital advertising and look to increase our digital marketing spend during times of lower market demand and cost. We also moderate our digital marketing spend during periods when our OOH customers may be less likely to sign up for our ad-supported OOH services (e.g., the winter holiday periods). A reduction in digital advertising spend by us during a particular period could slow our Loop Player distribution growth figures for a period of time, even as we continue to grow our overall distribution of Loop Players. We look to offset any slowed growth by, among other things, using data and analytics to make our individual digital ads more effective at acquiring customers.
Our Technology and Intellectual Property
We have developed all of our own software, computer code and related items to provide our service and do not materially rely on any third-party providers for the same. Our Loop Player is a proprietary device, designed by us and mostly built in-house. We do rely on third-party partners to provide services such as payment systems and server hosting platforms, all of which are industry-standard support systems, none of which have proprietary information and for which alternative providers can easily be found.
Our intellectual property rights are important to our business. We rely on a combination of patent, copyright, trademark, service mark, trade secret, and other rights in the United States and other jurisdictions, as well as confidentiality procedures and contractual provisions to protect our proprietary technology, processes and other intellectual property. We protect our intellectual property rights in a number of ways including entering into confidentiality and other written agreements with our employees, customers, consultants and partners in an attempt to control access to and distribution of our documentation and other proprietary technology and other information. Despite our efforts to protect our proprietary rights, third parties may, in an unauthorized manner, attempt to use, copy or otherwise obtain and market or distribute our intellectual property rights or technology.
U.S. patent filings are intended to provide the holder with a right to exclude others from making, using, selling or importing in the United States the inventions covered by the claims of granted patents. Our patents, including our
19
pending patents, if granted, may be contested, circumvented, or invalidated. Moreover, the rights that may be granted in those issued and pending patents may not provide us with proprietary protection or competitive advantages, and we may not be able to prevent third parties from infringing those patents. Therefore, the exact benefits of our issued patents and our pending patents, if issued, and the other steps that we have taken to protect our intellectual property cannot be predicted with certainty. See “Risk Factors—Risks Related to Our Intellectual Property—Failure to protect our intellectual property could substantially harm our business, operating results, and financial condition.”
Government Regulation
Our business and our devices and platform are subject to numerous domestic and foreign laws and regulations covering a wide variety of subject matters. These include general business regulations and laws, as well as regulations and laws specific to providers of Internet-delivered streaming services and Internet-connected devices. New or modified laws and regulations in these areas may have an adverse effect on our business. The costs of compliance with these laws and regulations are high and are likely to increase in the future. We anticipate that several jurisdictions may, over time, impose greater financial and regulatory obligations on us. If we fail to comply with these laws and regulations, we may be subject to significant liabilities and other penalties. Additionally, compliance with these laws and regulations could, individually or in the aggregate, increase our cost of doing business, impact our competitive position relative to our peers, and otherwise have an adverse impact on our operating results.
Data Protection and Privacy
We are subject to various laws and regulations covering the privacy and protection of users’ data. Because we handle, collect, store, receive, transmit, transfer, and otherwise process certain information, which may include personal information, regarding our users and employees in the ordinary course of business, we are subject to federal, state and foreign laws related to the privacy and protection of such data. These laws and regulations, and their application to our business, are increasingly shifting and expanding. Compliance with these laws and regulations, such as the California Consumer Privacy Act could affect our business, and their potential impact is unknown. Any actual or perceived failure to comply with these laws and regulations may result in investigations, claims and proceedings, regulatory fines or penalties, damages for breach of contract, or orders that require us to change our business practices, including the way we process data.
We are also subject to breach notification laws in the jurisdictions in which we operate, and we may be subject to litigation and regulatory enforcement actions as a result of any data breach or other unauthorized access to or acquisition or loss of personal information. Any significant change to applicable laws, regulations, interpretations of laws or regulations, or market practices, regarding the processing of personal data, or regarding the manner in which we seek to comply with applicable laws and regulations, could require us to make modifications to our products, services, policies, procedures, notices, and business practices, including potentially material changes. Such changes could potentially have an adverse impact on our business.
Corporate History & Business Development
We were incorporated in Nevada on May 11, 2015, as Interlink Plus, Inc.
The business we operated prior to February 2020 was sold and is no longer part of our business. The following discussion of the history of the “Loop” business includes our business as operated by Predecessor Loop prior to February 2020 and as operated by us thereafter.
| ● | 2016 – Founding of Loop - Loop was founded in 2016 by Jon Niermann (our Chief Executive Officer), Liam McCallum (our Chief Product and Technical Officer), and Shawn Driscoll (our Head of Investor Relations) with the intention of developing and then delivering a streaming video music service to consumers on their mobile devices. |
| ● | 2016 - Loop Acquires 20% of ScreenPlay - In 2016, Loop acquired 20% of the outstanding shares of ScreenPlay, which operated a business-focused computer-based video service providing music video and |
20
| other content to business venues. ScreenPlay owned a vast short-form video content library that contained over 500,000 videos, including music videos and movie and TV trailers. |
| ● | 2019 - Loop Acquires Remaining 80% of ScreenPlay – In 2019, Loop acquired the remaining 80% of outstanding shares of ScreenPlay, and ScreenPlay’s content became the foundation of the Loop business. Loop acquired ScreenPlay to obtain access to and ownership of ScreenPlay’s vast video content, which could then be delivered to Loop’s target retail customers, and to benefit from ScreenPlay’s relationships with the major music label companies whose licenses would be required to provide music video content to such retail customers. We also sought to leverage our technology and innovation to gain greater access to, and expand ScreenPlay’s business with OOH venues, which relied on costly computer hardware, long lead times for customer acquisition and high monthly subscription fees. Since the acquisition of ScreenPlay, we have continued to procure additional content, through acquisitions and licenses, to further grow our video library. |
| ● | February 2020 - Loop Business Becomes Part of a Public Reporting Company — In February 2020, as a result of the Merger with Predecessor Loop, we became an early-stage media company and acquired Predecessor Loop’s video streaming business and the management team of Predecessor Loop became our management team. We subsequently changed our name to “Loop Media, Inc.” and our trading symbol for our shares quoted on the over-the-counter market operated by OTC Markets to “LPTV.” |
| ● | March 2020 - Present - COVID 19 — The spread of COVID-19 around the world beginning in early 2020 adversely affected the United States and global economies and adversely impacted our customer base with the shutdown of most OOH venues in the United States beginning in March 2020 and subsequent limitations on OOH venue capacity in many States later in 2020 and into 2021. The impact of COVID-19 pandemic has adversely impacted our revenue for 2020. We believe, however, that the COVID-19 pandemic has accelerated the consideration by OOH operators of lower cost solutions to providing visual content in their venues. |
| ● | December 2019 – October 2020 - Loop Player — We introduced the Loop Player in 2019 as a Subscription service but didn’t experience substantive growth of our OOH business until the fourth quarter of 2020 when we made the Loop Player available for free to OOH venues. Coupled with our on-line marketing campaign and the introduction of our ad-supported service model, we experienced more significant growth in our OOH business starting in late 2020 and into 2021. |
| ● | October 2020 - Spkr, Inc. — In October 2020, we acquired from Spkr, Inc., a Delaware corporation, Spkr’s website and Internet domain name, Spkr.com, a mobile application that Spkr developed, available in the Apple Inc. IOS Store as Spkr: Curated Podcast Radio, and related assets. Spkr is a free audio platform that presents highly curated and editorialized long and short-form content. We believe the Spkr platform will help us further enhance our content and provide the basis for the creation and production of our own proprietary podcast-based video content. |
November 2020 - Loop Media Studios — In November 2020, we formed, and appointed Andy Schuon as Head of, Loop Media Studios. The formation of Loop Media Studios was intended to set the foundation for strong content expansion we expect will allow our DOOH and consumer platforms scale more efficiently. Loop Media Studios is responsible for all of our content and programming creation and acquisitions for both the OOH and D2C businesses. It is charged with bringing more structure to our content, underpinned by creation, curation, editorial and execution workstreams.
| ● | December 2020 – Loop Acquires 20% of EON Media — In December 2020, we acquired from Ithaca EMG Holdco LLC, a Delaware limited liability company (“Ithaca”), approximately 20% of the issued and outstanding shares of EON Media. EON Media is headquartered in Singapore and operates at the Asian intersection of music, media, entertainment and brand marketing. EON Media’s operations include syndicated content creation, music publishing, supervision and synchronization, as well as artist agency services. EON Media is also the producer and syndicator of Asia Pop 40, Asia’s first locally produced, multi- |
21
| language weekly radio chart programs, heard every week in over 100 markets in the Asia-Pacific and the Middle East. EON Media is the first step in our expansion into Asia and we believe it will help us market our services in the region. |
| ● | April 2021 – Loop Acquires Remaining 80% of EON Media — In April 2021, we acquired the remaining outstanding shares of EON Media from Far West Entertainment HK Limited, a company incorporated in Hong Kong, and hired Robert John Graham full time, the founder of EON Media. |
| ● | May 2021 – Loop’s Advertising Revenue Model More Fully Implemented — In May 2021, we completed the first stages of integrating our advertising revenue business model into our operations to allow for greater delivery of programmatic advertising and the sale of our advertising inventory. In May 2021, we also hired Bob Gruters as Chief Revenue Officer to drive our revenue through increased sponsorship of our content, prioritizing programmatic advertising revenue. |
| ● | June 2020 -October 2021 – Leadership Team - Between June 2020 and October 2021, we added a Head of Loop Media Studios, Chief Revenue Officer, General Counsel, Chief Content & Marketing Officer, Head of Music and Controller to our leadership team and two independent members to our Board of Directors. To complement our management team and Board of Directors, we have engaged a group of experienced advisors whom we refer to as our “Advisory Board.” We believe the Advisory Board will further enhance our credibility and provide strategic guidance to our business. |
Suppliers
We source our proprietary Loop Player from a third-party manufacturer. We believe the components and raw materials required for our Loop Player are readily available from a variety of sources. We have no long-term contracts or commitments for the supply of Loop Players.
Employees
We employed approximately 49 people as of September 30, 2021, 42 of whom were full-time employees and seven of whom were hourly contract workers. None of our employees are represented by a union in collective bargaining with us. We believe that our employee relations are good.
22
ITEM 1A. RISK FACTORS.
Summary of Risk Factors
In addition to the other information contained in this report, including the matters addressed under the heading “Forward-Looking Statements,” you should carefully consider all of the risks and uncertainties described in the section of this report captioned “Item 1A. Risk Factors.” These risks include, but are not limited to, the following:
Risks Related to Our Financial Condition
| ● | We have a limited operating history on which you can evaluate our business and prospects. |
| ● | We have generated minimal revenues under our current business model, which makes it difficult for us to evaluate our future business prospects and make decisions based on those estimates of our future performance. |
| ● | We have incurred significant operating losses in the past, and we may not be able to generate sufficient revenue to be profitable, or to generate positive cash flow on a sustained basis. In addition, our revenue growth rate may decline. |
Risks Related to Our Business
| ● | If our efforts to attract prospective OOH customers and direct-to-customer users and to retain existing customers and users of our service are not successful, our growth prospects and revenue will be adversely affected. |
| ● | We depend upon third-party licenses for substantially all of the content we stream and an adverse change to, loss of, or claim that we do not hold necessary licenses may materially adversely affect our business, operating results, and financial condition. |
| ● | We face and will continue to face competition for ad-supported users, Premium subscribers, and user listening time. |
| ● | We have no control over third-party providers of our content. The concentration of control of content by our major providers means that even one entity, or a small number of entities working together, may unilaterally affect our access to music video and other content. |
| ● | We are a party to many license agreements that are complex and impose numerous obligations upon us that may make it difficult to operate our business and provide all the functionality we would like for our services, and a breach of such agreements could adversely affect our business, operating results, and financial condition. |
| ● | Our royalty payment scheme is complex, and it is difficult to estimate the amount payable under our license agreements. We may underpay or overpay royalty amounts payable to others, which may harm our business. |
| ● | Minimum guarantees and advances required under certain of our license agreements may limit our operating flexibility and may adversely affect our business, operating results, and financial condition. |
| ● | Difficulties in obtaining accurate and comprehensive information necessary to identify the compositions embodied in music video sound recordings on our service and the ownership thereof may impact our ability to perform our obligations under our licenses, affect the size of our catalog that can be offered to customers and end-users, impact our ability to control content acquisition costs, and lead to potential copyright infringement claims. |
23
| ● | Our business emphasizes rapid innovation and prioritizes long-term customer and user engagement over short-term financial condition or results of operations. That strategy may yield results that sometimes do not align with the market’s expectations. If that happens, our stock price may be negatively affected. |
| ● | If we fail to accurately predict, recommend, curate and play content that our customers and users enjoy, we may fail to retain existing customers and users and attract new customers and users in sufficient numbers to meet investor expectations for growth or to operate our business profitably. |
| ● | Expansion of our operations to deliver content beyond music videos subjects us to increased business, legal, financial, reputational, and competitive risks. |
| ● | Streaming depends on effectively working with operating systems, online platforms, hardware, networks, regulations, and standards we do not control. Changes in our service or those operating systems, hardware, networks, regulations, or standards, and our limitations on our ability to access those platforms, operating systems, hardware, or networks may seriously harm our business. |
| ● | User metrics and other estimates could be subject to inherent challenges in measurement, and real or perceived inaccuracies in those metrics may seriously harm and negatively affect our reputation and our business. |
| ● | Various regulations as well as self-regulation related to privacy and data security concerns pose the threat of lawsuits, regulatory fines and other liability, require us to expend significant resources, and may harm our business, operating results, and financial condition. |
| ● | We rely on advertising revenue to monetize our service, and any failure to convince advertisers of the benefits of advertising on our service in the future could harm our business, operating results, and financial condition. |
| ● | We depend on highly skilled key personnel to operate our business, and if we are unable to attract, retain, and motivate qualified personnel, our ability to develop and successfully grow our business could be harmed. |
Risks Related to Our Intellectual Property
| ● | Assertions by third parties of infringement or other violation by us of their intellectual property rights could harm our business, operating results, and financial condition. |
| ● | Failure to protect our intellectual property could substantially harm our business, operating results, and financial condition. |
Risks Related to Owning Our Common Stock and this Offering
| ● | The trading price of our common stock has been and will likely continue to be volatile. |
| ● | Because of their significant ownership of our common stock, our founders and other large investors have substantial control over our business, and their interests may differ from our interests or those of our other stockholders. |
| ● | Exercise of warrants, and issuance of incentive stock grants may have a dilutive effect on our stock, and negatively impact the price of our common stock. |
Our business, prospects, financial condition or results of operations could be materially adversely affected by any of the risks and uncertainties set forth below, as well as in any amendments or updates reflected in subsequent filings with the SEC. In assessing these risks, you should also refer to other information contained in this Transition Report, including our financial statements and related notes.
24
Risks Related to Our Financial Condition
We have a limited operating history on which you can evaluate our business and prospects.
We have a limited operating history on which you can evaluate our business and our prospects. Although our company has existed since 2015, we have only operated as a public early-stage media company since our Merger in February 2020. The likelihood of success of our business plan must be considered in light of the risks, substantial expenses, difficulties, complications and delays frequently encountered in connection with developing and expanding early-stage businesses and the competitive environment in which we operate.
Potential investors should carefully consider the risks and uncertainties that a company with a limited operating history will face. In particular, potential investors should consider that we cannot assure you that we will be able to, among other things:
| ● | successfully implement or execute our current business plan, and we cannot assure you that our business plan is sound; |
| ● | attract and retain experienced management and advisors; |
| ● | secure acceptance of our products and services within the industry; |
| ● | raise sufficient funds in the capital markets or otherwise to effectuate our business plan; and |
| ● | utilize the funds that we do have and/or raise in the future to efficiently execute our business strategy. |
If we cannot successfully execute any one of the foregoing, our business may not succeed and your investment will be adversely affected.
We have generated minimal revenues under our current business model, which makes it difficult for us to evaluate our future business prospects and make decisions based on those estimates of our future performance.
For the twelve months ended December 30, 2020, substantially all our revenues were derived from the historical business of ScreenPlay, Inc., a Washington corporation (“ScreenPlay”), which we acquired in 2019, which relies on a paid subscription service-based model in OOH locations. However, our current business plan focuses on the ad-supported service provided through our proprietary Loop Player, which we began rolling out in the fourth calendar quarter of 2020. As a consequence, our past results may not be indicative of our expected future business results. Because of the related uncertainties, we may be hindered in our ability to anticipate and timely adapt to increases or decreases in sales, revenues, or expenses. If we make poor budgetary decisions as a result of unreliable data or if our business model is not accepted by the market, we may never become profitable and may continue to incur losses, which may result in a decline in our stock price.
25
We have incurred significant operating losses in the past, and we may not be able to generate sufficient revenue to be profitable, or to generate positive cash flow on a sustained basis. In addition, our revenue growth rate may decline.
We have incurred significant operating losses in the past and, as of September 30, 2021, had an accumulated deficit of $ (66,842,416). For the nine months ended September 30, 2021, and the twelve months ended December 31, 2020, our operating losses were $ (25,298,272) and $ (19,218,892), respectively. We have incurred significant costs to license content and continue to pay royalties or minimum guarantees to record labels, publishers, and other copyright owners for such content. We cannot guarantee that we will generate sufficient revenue from our efforts to monetize our services, including our paid subscription service and our free or unpaid advertising-supported services, to offset the cost of our content, these royalty expenses and our other operating costs. If we cannot successfully earn revenue at a rate that exceeds the operational costs, including royalty expenses and guarantee payments to the largest three music labels, associated with our service, we will not be able to achieve or sustain profitability or generate positive cash flow on a sustained basis.
Additionally, we also expect our costs to increase in future periods, which could negatively affect our future operating results and ability to achieve profitability. We expect to continue to expend substantial financial and other resources on:
| ● | securing top quality video content from leading record labels, distributors, and aggregators, as well as the publishing rights to any underlying musical compositions; |
| ● | creating new forms of original content; |
| ● | our technology infrastructure, including website architecture, development tools, scalability, availability, performance, security, and disaster recovery measures; |
| ● | research and development, including investments in our research and development team and the development of new features; |
| ● | sales and marketing, including a significant expansion of our field sales organization; |
| ● | international expansion to increase our member base, engagement, and sales; |
| ● | capital expenditures, including costs related to our technology development; and |
| ● | general administration, including legal and accounting expenses. |
These investments may not result in increased revenue or growth in our business. If we fail to continue to grow our revenue and overall business, our business, operating results, and financial condition would be harmed.
26
There is substantial doubt about our ability to continue as a going concern and if we are unable to generate significant revenue or secure additional financing, we may be unable to implement our business plan and grow our business.
We are a small and emerging media company that is in the process of rolling out a new business plan as our re-focused products and services have only recently been fully operational and ready for delivery to our customers. In particular, our historical sales have relied on our subscription service provided by the business we acquired from Screenplay, but our current business plan focuses on the ad-supported service provided through our proprietary Loop Player, which we began rolling out in the fourth calendar quarter of 2020. We have not generated sufficient revenues to operate our business. We have a significant accumulated deficit and have incurred operating losses for years and expect losses to continue during the remainder of our fiscal year ending September 30, 2022, and beyond. Our independent registered public accounting firm has indicated in their report that these conditions raise substantial doubt about our ability to continue as a going concern for a period of 12 months from the issuance date of our financial statements for the nine months ended September 30, 2021. The continuation of our business as a going concern is dependent upon the continued financial support from our current and potential stockholders. The Company’s primary source of operating funds since inception has been cash proceeds from debt and equity financing transactions. The ability of the Company to continue as a going concern is dependent upon its ability to generate sufficient revenue and its ability to raise additional funds by way of its debt and equity financing efforts. There can be no assurance that adequate financing will be available in a timely manner, on acceptable terms, or at all.
There is uncertainty regarding our ability to grow our business or to continue as a going concern without additional financing. We have no agreements, commitments, or understandings to secure additional financing at this time. Our long-term future growth and success are dependent upon our ability to continue selling our services, generate cash from operating activities and obtain additional financing. We may be unable to continue selling our products and services, generate sufficient cash from operations, sell additional shares of common stock or borrow additional funds. Our inability to obtain additional cash could have a material adverse effect on our ability to grow our business to a greater extent than we can with our existing financial resources.
We will require additional capital to support business and objectives, and this capital might not be available on acceptable terms, if at all.
We intend to continue to make investments to support our business and will require additional funds to respond to business challenges, including the need to develop new features or enhance our existing service, expand into additional markets around the world, improve our infrastructure, or acquire complementary businesses and technologies. Accordingly, we have in the past engaged, and may in the future engage, in equity and debt financings to secure additional funds. If we raise additional funds through future issuances of equity or convertible debt securities, our stockholders could suffer significant dilution, and any new equity securities we issue could have rights, preferences, and privileges superior to those of holders of our common stock. Any debt financing, we secure in the future could also contain restrictive covenants relating to our capital-raising activities and other financial and operational matters, which may make it more difficult for us to obtain additional capital and pursue business opportunities, including potential acquisitions. We may not be able to obtain additional financing on terms favorable to us, if at all. If we are unable to obtain adequate financing or financing on terms satisfactory to us when we require it, our ability to continue to support our business, acquire or retain users, and to respond to business challenges could be significantly impaired, and our business may be harmed.
Risks Related to Our Business
If our efforts to attract prospective OOH customers and direct-to-consumer users and to retain existing customers and users of our service are not successful, our growth prospects and revenue will be adversely affected.
Our ability to grow our OOH business and generate revenue depends on retaining, expanding, and effectively monetizing our OOH customer base, including by increasing the number of venues that have adopted our service and increasing advertising revenue on our OOH ad-supported service delivered through our Loop Player and monetizing content across our OOH business. We must convince prospective OOH customers of the benefits of our service and our existing users of the continuing value of our service. Our ability to attract new customers, retain existing customers, and
27
convert users of our OOH subscription service to our OOH ad-supported service depends in large part on our ability to continue to offer compelling curated content, leading technologies and products like the Loop Player, superior functionality, and an engaging customer experience.
Our ability to grow our D2C business and generate revenue depends on retaining, expanding, and effectively monetizing our total user base, including by increasing advertising revenue on our D2C ad-supported service, increasing the number of subscribers to our premium service, and finding ways to monetize content across the service. We must convince prospective users of the benefits of our service and our existing users of the continuing value of our service. Our ability to attract new users, retain existing users, and convert users of our ad-supported service to subscribers to our subscription service depends in large part on our ability to continue to offer leading technologies and products, compelling highly curated content, superior functionality, and an engaging user experience. As consumer tastes and preferences change on the Internet and with mobile devices and other internet-connected products, we will need to enhance and improve our existing service, introduce new services and features, and maintain our competitive position with additional technological advances and an adaptable platform. If we fail to keep pace with technological advances or fail to offer compelling product offerings and state-of-the-art delivery platforms to meet consumer demands, our ability to grow or sustain the reach of our services, attract and retain users, and increase our Premium subscribers to our Loop App may be adversely affected.
In addition, in order for us to increase our advertising revenue, we also seek to increase the viewing time that our ad-supported OOH customers and D2C users spend on our ad-supported service and find new opportunities to deliver advertising to users on the service. The more content users stream on the ad-supported service, the more advertising inventory we generally are able to sell. Further, growth in our ad-supported user base increases the size and scope of user pools targeted by advertisers, which improves our ability to deliver relevant advertising to those users in a manner that maximizes our advertising customers’ return on investment and that ultimately allows us to better demonstrate the effectiveness of our advertising solutions and justifies a pricing structure that is advantageous for us. If we fail to grow our ad-supported OOH customer and user base, the amount of content streamed, and the listening time spent by our ad-supported OOH customers and users, we may be unable to grow ad-supported revenue.
In order to increase our ad-supported OOH customers and users and our Premium subscribers, we will need to address a number of challenges, including:
| ● | improving our ad-supported service; |
| ● | providing users with a consistently high-quality and user-friendly experience; |
| ● | continuing to curate a catalog of content that consumers want to engage with on our service; |
| ● | continuing to innovate and keep pace with changes in technology and our competitors; and |
| ● | maintaining and building our relationships with the makers of consumer products such as mobile devices and connected TVs (“CTVs”). |
Failure to overcome any one of these challenges could have a material adverse effect on our business, operating results, and financial condition.
We must operate our business in compliance with the licenses that we require to provide our services.
The provisions of certain of our license agreements may require consent to implement improvements to, or otherwise change, our services. We may not be able to obtain consent from our rights holders to add additional features and functionality to our services or our rights holders may be delayed in providing such consent, which may hinder our ability to be responsive to our users’ tastes and preferences and may make us less competitive with other services. For example, we may need to obtain consent of rights holders to add the ability for customers of OOH locations to interact with certain of our content and determine which music videos might play next. In many instances, improvements to the
28
functionality of our services may require the consent of rights holders and, in some such instances, increases in fee payments to such rights holders. We cannot ensure that any such additional required fees will be on financially feasible terms for the Company and, as a result, we may be required to develop alternative options or forego functionality improvements to our services which could negatively impact our business and financial results.
We face and will continue to face competition for ad-supported users, premium subscribers, and user listening time.
We compete for the time and attention of our D2C users with other content providers based on a number of factors, including quality of experience, relevance, diversity of content, ease of use, price, accessibility, perception of advertising load, brand awareness, and reputation.
We compete with providers of music videos and other short-form unscripted video content, which is purchased or available for free and playable on mobile or other connected devices, including CTVs. These forms of media may be downloaded or accessed by content streams from other online services, including YouTube and Vevo. Many of our current or future competitors are already entrenched or may have significant brand recognition, existing user bases, and/or ability to bundle with other goods and/or services, both globally and regionally, and/or markets which we seek to penetrate.
We also compete with providers of non-music content that offer an on-demand catalog of differing content that is similar to certain of our content, such as the “fail” videos, pet videos and drone footage that we offer in the OOH market. We face increasing competition from a growing variety of content providers that seek to differentiate their service by content offering and product features, and they may be more successful than us in predicting user preferences, providing popular content, and innovating new features.
We believe that companies with a combination of technical expertise, brand recognition, financial resources, and digital media experience also pose a significant threat of developing competing music video and other video distribution technologies. If known incumbents in the digital media or entertainment space choose to offer competing services, they may devote greater resources than we have available, have a more accelerated time frame for deployment, and leverage their existing user base and proprietary technologies to provide services that our users and advertisers may view as superior. Our current and future competitors may have higher brand recognition, more established relationships with content licensors and mobile device manufacturers, greater financial, technical, and other resources, more sophisticated technologies, and/or more experience in the markets in which we compete. Our current and future competitors may also engage in mergers or acquisitions with each other to combine and leverage their customers and audiences, making them larger and potentially providing them a competitive advantage in negotiations with counter parties or in marketing to potential customers that we also target. Our current and future competitors may innovate new features or introduce new ways of consuming or engaging with content that cause our users to use or switch to another product, which would negatively affect our user retention, growth, and engagement.
We compete for a share of advertisers’ overall marketing budgets with other content providers on a variety of factors, including perceived return on investment, effectiveness, and relevance of our advertising products; our pricing structure; and our ability to deliver large volumes or precise types of advertisements to targeted user demographic pools. We also compete for advertisers with a range of internet companies, including major internet portals, search engine companies, social media sites, and mobile applications, as well as traditional advertising channels such as terrestrial radio and television.
Large internet companies with strong brand recognition, such as Facebook, Google, Amazon, and Twitter, have significant numbers of sales personnel, substantial advertising inventory, proprietary advertising technology solutions, and traffic across web, mobile, and connected devices that provide a significant competitive advantage and have a significant impact on pricing for reaching these user bases. Failure to compete successfully against our current or future competitors could result in the loss of current or potential advertisers, a reduced share of our advertisers’ overall marketing budget, the loss of existing or potential users, or diminished brand strength, which could adversely affect our pricing and margins, lower our revenue, increase our research and development and marketing expenses, and prevent us from achieving or maintaining profitability.
29
We depend upon third-party licenses for substantially all of the content we stream and an adverse change to, loss of, or claim that we do not hold necessary licenses may materially adversely affect our business, operating results, and financial condition.
To secure the rights to stream content, we enter into license agreements to obtain licenses from rights holders such as record labels, recording artists, music publishers, performance rights organizations, collecting societies, and other copyright owners or their agents, and we pay royalties or other consideration to such parties or their agents. We cannot guarantee that our efforts to obtain all necessary licenses to stream content will be successful, nor that the licenses available to us now will continue to be available in the future at rates and on terms that are favorable or commercially reasonable or at all. The terms of these licenses, including the royalty rates that we are required to pay pursuant to them, may change as a result of changes in our bargaining power, the industry, laws and regulations, or for other reasons. Increases in royalty rates or changes to other terms of these licenses may materially impact our business, operating results, and financial condition.
We enter into music license agreements to obtain rights to stream music videos, including from the major record labels who hold the rights to stream a significant number of sound recordings—Universal Music Group (“Universal”), Sony Music Entertainment (“Sony”), and Warner Music Group (“Warner” and collectively with Universal and Sony, the “Music Labels”). Our current license agreements with the Music Labels for our OOH business have been in effect (or have been renewed) for several years, and the Music Labels have requested a review and update of those licenses. Although the basic outlines of these licenses are standardized by the licensors and we do not anticipate any issue in the timely renewal of these licenses, the updating of such licenses may increase our license costs associated with such rights, including the percentage of revenue attributable to the record labels and our minimum guaranteed payment obligations. A significant majority of our OOH business relies upon these licenses, and if we fail to maintain and renew these licenses our business, operating results, and financial condition could be materially harmed. With respect to our D2C business, the licenses with the Music Labels are similarly standardized, and although we do not anticipate any issue in the timely renewal of these licenses as needed, any future updates of such licenses similarly may increase our license costs associated with such rights, including the percentage of revenue attributable to the record labels and our minimum guaranteed payment obligations.
Our business model requires that we also obtain two additional types of licenses with respect to musical compositions: mechanical and public performance rights. Mechanical licenses are required to distribute recordings written by someone other than the distributor. Such licenses ensure that the music publisher, and ultimately the songwriter, receives compensation for the use of their work. A public performance license is an agreement between a music user and the owner of a copyrighted composition (song) that grants permission to play the song in public, online, or on radio.
We have obtained direct licenses for mechanical rights with the three largest publishers, which are respective affiliates of each of the Music Labels, for our OOH and direct to consumer businesses. As a general matter, once music licenses are obtained from the Music Labels, their affiliate publishing companies enter into agreements with respect to the mechanical licenses. If our business does not perform as expected or if the rates are modified to be higher than the proposed rates, our music video content acquisition costs could increase, which could negatively impact our business, operating results, and financial condition, hinder our ability to provide interactive features in our services, or cause one or more of our services not to be economically viable due to an increase in content acquisition costs.
In the United States, public performance rights are generally obtained through intermediaries known as performance rights organizations (“PROs”), which negotiate blanket licenses with copyright users for the public performance of compositions in their repertory, collect royalties under such licenses, and distribute those royalties to music publishers and songwriters. The royalty rates available to us today may not be available to us in the future. Licenses provided by two of these PROs: the American Society of Composers, Authors and Publishers (“ASCAP”) and Broadcast Music, Inc. (“BMI”), cover much of the music we stream. ASCAP and BMI are governed by consent decrees relating to decades-old litigations. These agreements typically have one-to-two-year terms, and some have continuous renewal provisions, with either party able to terminate for convenience within 30 to 60 days prior to the end of the applicable term (or commencement of the subsequent term), and are limited to the territory of the United States and its territories and possessions. An increase in the number of compositions that must be licensed from PROs that are not subject to the consent decrees could likewise impede our ability to license public performance rights on favorable terms and may increase the cost of our operations.
30
In other parts of the world, including Latin America, we obtain reproduction and performance licenses for musical compositions either through local collecting societies representing publishers or from publishers directly, or a combination thereof. We cannot guarantee that our licenses with collecting societies and our direct licenses with publishers provide full coverage for all of the musical compositions we make available to our users in such countries.
With respect to non-music content, we obtain distribution rights directly from rights holders. We either negotiate licenses directly with individuals or entities. We are dependent on those who provide content on our service complying with the terms and conditions of our license agreements. However, we cannot guarantee that rights holders or content providers will comply with their obligations, and such failure to do so may materially impact our business, operating results, and financial condition.
There is also no guarantee that we have all of the licenses we need to stream content, as the process of obtaining such licenses involves many rights holders, some of whom are unknown, and a myriad of complex legal issues across many jurisdictions, including open questions of law as to when and whether particular licenses are needed. Additionally, there is a risk that rights holders, creators, performers, writers and their agents, or societies, unions, guilds, or legislative or regulatory bodies will create or attempt to create new rights or regulations that could require us to enter into license agreements with, and pay royalties to, newly defined groups of rights holders, some of which may be difficult or impossible to identify.
Even when we are able to enter into license agreements with rights holders, we cannot guarantee that such agreements will continue to be renewed indefinitely. For example, from time to time, our license agreements with certain rights holders and/or their agents expire while we negotiate their renewals and, per industry custom and practice, we may enter into brief (for example, month-, week-, or even days-long) extensions of those agreements or provisional licenses and/or continue to operate on an at-will basis as if the license agreement had been extended, including by our continuing to make content available. During these periods, we may not have assurance of long-term access to such rights holders’ content, which could have a material adverse effect on our business and could lead to potential copyright infringement claims. It is also possible that such agreements will never be renewed at all. License agreements are generally restrictive as to how the licensed content is accessed, displayed, and manipulated, as licensors seek to protect the use of their content. In order to provide the highest level of services and best experience for our customers and end-users, we may from time to time seek expansion of our licenses to provide us with greater functionality of our services as it relates to the relevant content. The inability to expand our licenses, or the lack of renewal, or termination, of one or more of our license agreements, or the renewal of a license agreement on less favorable terms, could have a material adverse effect on our business, operating results, and financial condition.
We have no control over third-party providers of our content. The concentration of control of content by our major providers means that even one entity, or a small number of entities working together, may unilaterally affect our access to music video and other content.
We rely on various rights holders, over whom we have no control, for the content we make available on our service. We cannot guarantee that these parties will always choose to license to us or license to us on terms that are acceptable to us.
The music industry has a high level of concentration, which means that one or a small number of entities may, on their own, take actions that adversely affect our business. For example, with respect to music video content, the audio/visual (“A/V”) recordings licensed to us under our agreements with Universal, Sony, and Warner make up the vast majority of the music currently consumed on our service. Our business may be adversely affected if our access to music is limited or delayed because of deterioration in our relationships with one or more of these significant rights holders or if they choose not to license to us for any other reason. In addition, rights holders also may attempt to take advantage of their market power (including by leveraging their publishing affiliate) to seek onerous financial or other terms from us or otherwise impose restrictions that hinder our ability to further innovate our services and content offerings. This may be of particular concern in markets where local content is important and such local content is held by local major labels or even individual artists, making it difficult to obtain such local content at all or on economically favorable terms. As a result, the loss of rights to a major publisher catalog would force us to take down a significant portion of popular repertoire in the applicable territory or territories, which would significantly disadvantage us in such territory or territories. The lack of
31
complete metadata with respect to publisher ownership may also present challenges in taking down all the tracks of a given publisher. Even if we can secure rights to music video content from record labels and other copyright owners, recording artists may object and may exert public or private pressure on those record labels or copyright owners or other third parties to discontinue licensing rights to us, hold back content from us, or increase royalty rates. As a result, our ability to continue to license rights to music video content is subject to convincing a broad range of stakeholders of the value and quality of our service. To the extent that we are unable to license a large amount of content or the content of certain popular artists, our business, operating results, and financial condition could be materially harmed.
We are a party to many license agreements that are complex and impose numerous obligations upon us that may make it difficult to operate our business and provide all the functionality we would like for our services, and a breach of such agreements could adversely affect our business, operating results, and financial condition.
Many of our license agreements are complex and impose numerous obligations on us, including obligations to, among other things:
| ● | calculate and make payments based on complex royalty structures, which requires tracking usage of content on our service that may have inaccurate or incomplete metadata necessary for such calculation; |
| ● | provide periodic reports on the exploitation of the content; |
| ● | represent that we will obtain all necessary publishing licenses and consents and pay all associated fees, royalties, and other amounts due for the licensing of musical compositions; |
| ● | provide advertising inventory at discounted rates or on other favorable terms; |
| ● | comply with certain service offering restrictions; |
| ● | comply with certain marketing and advertising restrictions; and |
| ● | comply with certain security and technical specifications. |
Many of our license agreements grant the licensor the right to audit our compliance with the terms and conditions of such agreements. Some of our license agreements also include steering, non-discrimination, and so-called “most favored nations” provisions, which require that certain material terms of such agreements are no less favorable than those provided in our agreements with any other similarly situated licensor. If triggered, these provisions could cause our payments or other obligations under those agreements to escalate substantially. Additionally, some of our license agreements require consent to undertake certain business initiatives and, without such consent, our ability to undertake or continue operating new business initiatives may be limited. This could hurt our competitive position.
If we materially breach any of these obligations or any other obligations set forth in any of our license agreements, or if we use content in ways that are found to exceed the scope of such agreements, we could be subject to monetary penalties, and/or rights holders could impede our business by withholding content, discounts, and bundle approvals and the rights to launch new service offerings, and could ultimately terminate our rights under such license agreements, any of which could have a material adverse effect on our business, operating results, and financial condition.
The coronavirus COVID-19 pandemic or the widespread outbreak of any other communicable disease could materially and adversely affect our business, financial condition and results of operations.
The spread of COVID-19 around the world is continuing to affect the United States and global economies and has affected our operations and those of third parties on which we rely, including by causing disruptions in staffing, order fulfillment, and demand for product. In addition, the COVID-19 pandemic has and may continue to affect our revenue significantly in 2022 and beyond. In particular, many OOH venues have closed or limited their public capacity, which may impact their willingness to invest in on-site entertainment, such as our services. Additionally, while the potential economic
32
impact brought by, and the duration of, the COVID-19 pandemic is difficult to assess or predict, the impact of the COVID-19 pandemic on the global financial markets may reduce our ability to access capital, which could negatively impact our short-term and long-term liquidity. The continuing impact of the COVID-19 pandemic in 2022 is highly uncertain and subject to change.
As COVID-19 continues to evolve, the extent to which COVID-19 impacts operations will depend on future developments, which are highly uncertain and cannot be predicted with confidence, including the duration and severity of the outbreak, and the actions that may be required to try and contain COVID-19 or treat its impact. We continue to monitor the pandemic and, the extent to which the continued spread of the virus adversely affects our customer base and therefore revenue. As the COVID-19 pandemic is complex and rapidly evolving, our plans as described above may change. At this point, we cannot reasonably estimate the duration and severity of this pandemic, which could have a material adverse impact on our business, results of operations, financial position and cash flows.
Our royalty payment scheme is complex, and it is difficult to estimate the amount payable under our license agreements. We may underpay or overpay royalty amounts payable to others, which may harm our business.
Under our license agreements and relevant statutes, we must pay all required royalties to record labels, music publishers, and other copyright owners in order to stream content. The determination of the amount and timing of such payments is complex and subject to a number of variables, including the type of content streamed, the country in which it is streamed, the service tier such content is streamed on, the amount of revenue generated by the streaming of the content, the identity of the license holder to whom royalties are owed, the current size of our user base, our current ratio of ad-supported users to Premium subscribers in each of our OOH and D2C businesses, the applicability of any most favored nations provisions, and any applicable advertising fees and discounts, among other variables. Additionally, we have certain arrangements whereby royalty costs are paid in advance or are subject to minimum guaranteed amounts. An accrual is estimated when actual royalty costs to be incurred during a contractual period are expected to fall short of the minimum guaranteed amount. Additionally, we also have license agreements that include so-called “most favored nations” provisions that require that the material terms of such agreements are the most favorable material terms provided to any music licensor, which, if triggered, could cause our royalty payments under those agreements to escalate substantially. As we have only recently begun to grow our D2C business and have yet to recognize substantial revenue from such services and may not do so during the initial term of our licenses, we expect that any minimum guaranteed payments on licenses required for that service will be the maximum we will need to pay out under those licenses for the relevant time period.
We cannot assure you that the internal controls and systems we use to determine royalties payable will always be effective. We have in the past identified material weaknesses in our internal control over financial reporting that related to, among other things, accounting for rights holder liabilities and may identify additional material weaknesses in the future. If we fail to implement and maintain effective controls relating to rights holder liabilities, we may underpay/under-accrue or overpay/over-accrue the royalty amounts payable to record labels, music publishers, and other copyright owners. Underpayment could result in (i) litigation or other disputes with record labels, music publishers, and other copyright owners; (ii) the unexpected payment of additional royalties in material amounts; and (iii) damage to our business relationships with record labels, music publishers, other copyright owners, and artists and/or artist groups. If we overpay royalties, we may be unable to reclaim such overpayments, and our profits will suffer. Failure to accurately pay our royalties may adversely affect our business, operating results, and financial condition.
Minimum guarantees and advances required under certain of our license agreements may limit our operating flexibility and may adversely affect our business, operating results, and financial condition.
Certain of our license agreements contain significant minimum guarantees or advanced payments. Such minimum guarantees related to our content acquisition costs are not always tied to our revenue and/or user growth forecasts (e.g., number of users, active users, Premium subscribers) or the number of video music sound recordings and musical compositions used on our services. Accordingly, our ability to achieve and sustain profitability and operating leverage on our services in part depends on our ability to increase our revenue through increased sales of our services and advertising sales on terms that maintain an adequate gross margin. The duration of our license agreements for sound recordings and musical compositions that contain minimum guarantees is frequently two years, but we do not currently have enough customers and do not anticipate acquiring enough customers whose revenue could cover such minimum guarantees and
33
any existing customers may cancel their services at any time. Our forecasts of customer acquisition or retention and advertising sales during the term of our license agreements do not meet the number of customers required to cover our minimum guaranteed payments. To the extent our service revenue growth or advertising sales do not materially increase during the term of our license agreements, our business, operating results, and financial condition will be adversely affected as a result of such minimum guarantees. In addition, the fixed cost nature of these minimum guarantees may limit our flexibility in planning for, or reacting to, changes in our business and the market segments in which we operate.
We rely on estimates of the market share of streaming content owned by each content provider, as well as our own user growth and forecasted advertising revenue, to forecast whether such minimum guarantees could be recouped against our actual content acquisition costs incurred over the duration of the license agreement. As we are in the early stages of developing our D2C business we expect the minimum guarantees not to be recouped for the foreseeable future.
Difficulties in obtaining accurate and comprehensive information necessary to identify the compositions embodied in music video sound recordings on our services and the ownership thereof may impact our ability to perform our obligations under our licenses, affect the size of our catalog that can be offered to customers and end-users, impact our ability to control content acquisition costs, and lead to potential copyright infringement claims.
Comprehensive and accurate ownership information for the musical compositions embodied in music videos is often unavailable to us or difficult or, in some cases, impossible for us to obtain, sometimes because it is withheld by the owners or administrators of such rights. We currently rely on the assistance of third parties to determine certain of this information. If the information provided to us or obtained by such third parties does not comprehensively or accurately identify the ownership of musical compositions, or if we are unable to determine which musical compositions correspond to specific sound recordings, it may be difficult or impossible to identify the appropriate rights holders from whom to obtain licenses or to whom to pay royalties. This may make it difficult to comply with the obligations of any agreements with those rights holders. This may also make it difficult to identify content for removal from the services if we lose the rights to such musical compositions. These challenges, and others concerning the licensing of musical compositions embodied in sound recordings and music videos on our services, may subject us to significant liability for copyright infringement, breach of contract, or other claims.
We face many risks associated with our international expansion, including difficulties obtaining rights to stream content on favorable terms.
We are considering the further expansion of our operations into additional international markets. However, offering our services in a new geographical area involves numerous risks and challenges. For example, the licensing terms offered by rights organizations and individual copyright owners in countries around the world are currently relatively expensive. Addressing licensing structure and royalty rate issues in any new geographic market requires us to make very substantial investments of time, capital, and other resources, and our business could fail if such investments do not succeed. There can be no assurance that we will succeed or achieve any return on these investments.
In addition to the above, expansion around the world exposes us to other risks such as:
| ● | lack of well-functioning copyright collective management organizations that are able to grant us music video licenses, process reports, and distribute royalties in certain markets; |
| ● | fragmentation of rights ownership in various markets and lack of transparency of rights coverage, which may lead to overpayment or underpayment to record labels, music publishers, artists, performance rights organizations, and other copyright owners; |
| ● | difficulties in obtaining license rights to local content; |
| ● | increased risk of disputes with and/or lawsuits filed in foreign jurisdictions by rights holders in connection with our expansion into new markets; |
34
| ● | difficulties in achieving market acceptance of our services in different geographic markets with different tastes and interests; |
| ● | difficulties in achieving viral marketing growth in certain other countries where we commit fewer sales and marketing resources; |
| ● | difficulties in managing operations due to language barriers, distance, staffing, user behavior and spending capability, cultural differences, business infrastructure constraints, and laws regulating corporations that operate internationally; |
| ● | application of different laws and regulations of other jurisdictions, including privacy, censorship, data protection and liability standards and regulations, as well as intellectual property laws; |
| ● | potential adverse tax consequences associated with foreign operations and revenue; |
| ● | complex foreign exchange fluctuation and associated issues; |
| ● | increased competition from local websites and audio content providers, some with financial power and resources to undercut the market or enter into exclusive deals with local content providers to decrease competition; |
| ● | credit risk and higher levels of payment fraud; |
| ● | political and economic instability in some countries; |
| ● | restrictions on international monetary flows; and |
| ● | reduced or ineffective protection of our intellectual property rights in some countries. |
As a result of these obstacles, we may find it impossible or prohibitively expensive to enter additional markets, or entry into foreign markets could be delayed, which could hinder our ability to grow our business.
If we fail to effectively manage our expected growth, our business, operating results, and financial condition may suffer.
Our growth in recent months has placed, and will continue to place, significant demands on our management and our operational and financial infrastructure. In order to attain and maintain profitability, we will need to recruit, integrate, and retain skilled and experienced personnel who can demonstrate our value proposition to users, advertisers, and business partners and who can increase the monetization of the content streamed on our services, particularly in OOH venues and on CTVs and mobile devices. Continued growth could also strain our ability to maintain reliable service levels for our users, effectively monetize the video content streamed, develop and improve our operational and financial controls, and recruit, train, and retain highly skilled personnel. As we seek to grow our operations in size, scope, and complexity, we will need to improve and upgrade our systems and infrastructure, which will require significant expenditures and allocation of valuable technical and management resources. If we fail to maintain efficiency and allocate limited resources effectively in our organization as it grows, our business, operating results, and financial condition may suffer.
Our business emphasizes rapid innovation and prioritizes long-term customer and user engagement over short-term financial condition or results of operations. That strategy may yield results that sometimes do not align with the market’s expectations. If that happens, our stock price may be negatively affected.
Our business is expected to grow and become more complex, and our success depends on our ability to quickly develop and launch new and innovative products. Our approach to the development of our business could result in unintended outcomes or decisions that are poorly received by our users, advertisers, or partners. We have made, and expect
35
to continue to make, significant investments to develop and launch new products, services, and initiatives, which may involve significant risks and uncertainties, including the fact that such offerings may not be commercially viable for an indefinite period or at all, or may not result in an adequate return of capital on our investments. No assurance can be given that such new offerings will be successful and will not adversely affect our reputation, operating results, and financial condition. In certain instances, we prioritize our long-term customer and user engagement over short-term financial condition or results of operations. We may make decisions that reduce our short-term revenue or profitability if we believe that the decisions benefit the aggregate customer and user experience and will thereby improve our financial performance over the long term. These decisions may not produce the long-term benefits that we expect, in which case our user growth and engagement, our relationships with advertisers and partners, as well as our business, operating results, and financial condition could be seriously harmed.
If we fail to accurately predict, recommend, curate and play content that our customers and users enjoy, we may fail to retain existing customers and users and attract new customers and users in sufficient numbers to meet investor expectations for growth or to operate our business profitably.
We believe that a key differentiating factor between Loop Media and other streaming content providers in the OOH and D2C markets is our ability to curate content and deliver that content to customers and users for them to enjoy. We have invested, and will continue to invest, significant resources in our content curation and technologies that help predict what customers and users will enjoy. However, such investments may not yield an attractive return and such refinements may not be effective. The effectiveness of our ability to predict user preferences and curate content tailored to our customers and users’ individual tastes depends in part on our ability to gather and effectively analyze large amounts of customer and user data. While we have a large catalog of music videos and other content available to stream, we must continuously identify, analyze, and curate additional content that our customers request and that our users will enjoy, and we may not effectively do so. Failure to do so could materially adversely affect our ability to adequately attract and retain users, increase content hours consumed, and sell advertising to meet investor expectations for growth or to operate the business profitably.
If we are unable to generate revenue from our services on CTVs and mobile and connected devices, our results of operations may be materially adversely affected.
Our business model with respect to monetization of our services on CTVs and mobile and connected devices is still evolving. As we expand into providing content direct to consumers, there is increasing pressure to monetize mobile and other connected devices, including CTVs and other in-home devices. We offer our services through our Loop App on CTVs and mobile and connected devices, from which we seek to generate advertising revenue. However, to date, we primarily rely on our OOH services to generate revenue. If we are unable to effectively monetize our D2C services on CTVs and mobile and connected devices, our business, operating results, and financial condition may suffer.
Expansion of our operations to deliver content beyond music videos subjects us to increased business, legal, financial, reputational, and competitive risks.
Expansion of our operations to deliver content beyond music videos involves numerous risks and challenges, including increased capital requirements, new competitors, and the need to develop new strategic relationships. Growth in these areas may require additional changes to our existing business model and cost structure, modifications to our infrastructure, and exposure to new regulatory, legal, and reputational risks, including infringement liability, any of which may require additional expertise that we currently do not have. We may not be able to generate sufficient revenue from non-music video content to offset the costs of creating or acquiring this content. Further, we have initially established a reputation as a music video streaming service and our ability to gain acceptance and listenership for other non-music video content, and thus our ability to attract users and advertisers to this content, is not certain. Failure to successfully monetize and generate revenues from such content, including failure to obtain or retain rights to non-music video content on acceptable terms, or at all, or to effectively manage the numerous risks and challenges associated with such expansion could adversely affect our business, operating results, and financial condition.
36
Streaming depends on effectively working with operating systems, online platforms, hardware, networks, regulations, and standards we do not control. Changes in our services or those operating systems, hardware, networks, regulations, or standards, and our limitations on our ability to access those platforms, operating systems, hardware, or networks may seriously harm our business.
We rely on a variety of operating systems, online platforms, hardware, and networks to reach our users. These platforms range from desktop and mobile operating systems and application stores to wearables and over-the-top (“OTT”) distribution platforms and services. The owners or operators of these platforms and services may not share our interests and may restrict our access to them or place conditions on access that would materially affect our ability to access those platforms and services. In particular, where the owner of a platform is also our direct competitor, the platform may attempt to use this position to affect our access to users and ability to compete. For example, an online platform might arbitrarily remove our services from its platform, deprive us of access to business-critical data, or engage in other harmful practices. Online platforms also may unilaterally impose certain requirements that negatively affect our ability to convert users of our Loop App to the Premium services, such as conditions that limit our freedom to communicate promotions and offers to our users. Similarly, online platforms may force us to use the platform’s payment processing systems that may be inferior to, and more costly than, other payment processing services available in the market. Online platforms frequently change the rules and requirements for services like ours to access the platform, and such changes may adversely affect the success or desirability of our services. To maintain certain elements of the services on a platform, we may need to make additional concessions to the platform operator that may adversely affect other aspects of the business or require us to invest significant expenses. Online platforms may limit our access to information about users, limiting our ability to convert and retain them. Online platforms also may deny access to application programming interfaces or documentation, limiting the functionality of our services on the platform.
Because devices providing access to our services are not manufactured and sold by us, these devices may not perform reliably, and any faulty connection between these devices and our services may result in consumer dissatisfaction toward us, which could damage our brand. We may not be able to comply with the requirements of various operating systems, online platforms, hardware, networks, regulations, and standards on which our services depend, and failure to do so could result in serious harm to our business.
If our security systems are breached, we may face civil liability and/or statutory fines, and/or enforcement action causing us to change our practices, and public perception of our security measures could be diminished, either of which would negatively affect our ability to attract and retain OOH Customers, Premium subscribers, ad-supported users, advertisers, content providers, and other business partners.
Techniques used to gain unauthorized access to data and software are constantly evolving, and we may be unable to anticipate or prevent unauthorized access to data pertaining to our users, including credit card and debit card information and other personal data about our users, business partners, and employees. Like all internet services, our services, which is supported by our own systems and those of third parties that we work with, is vulnerable to software bugs, computer viruses, internet worms, break-ins, phishing attacks, attempts to overload servers with denial-of-service, or other attacks and similar disruptions from unauthorized use of our and third-party computer systems, any of which could lead to system interruptions, delays, or shutdowns, causing loss of critical data or unauthorized access to personal data. Computer malware, viruses, and computer hacking, and phishing attacks have become more prevalent in our industry and may occur on our systems in the future. Though it is difficult to determine what, if any, harm may directly result from any specific interruption or attack, any failure to maintain performance, reliability, security, and availability of our products and technical infrastructure to the satisfaction of our users may harm our reputation and our ability to retain existing users and attract new users. The systems and processes that we have designed to protect our data and our users’ data, to prevent data loss, to disable undesirable accounts and activities on our platform, and to prevent or detect security breaches, may not prevent security breaches, and we may incur significant costs in protecting against or remediating cyber-attacks.
In addition, if an actual or perceived breach of security occurs to our systems or a third party’s systems, we may face regulatory or civil liability and public perception of our security measures could be diminished, either of which would negatively affect our ability to attract and retain users, which in turn would harm our efforts to attract and retain advertisers, content providers, and other business partners. We also would be required to expend significant resources to mitigate the breach of security and to address matters related to any such breach.
37
Certain of our license agreements, including those with the Music Labels, have provisions that allow for the termination of such agreements in the case of an uncured data security breach. Any failure, or perceived failure, by us to maintain the security of data relating to our users, to comply with our posted privacy policy, laws and regulations, rules of self-regulatory organizations, industry standards, and contractual provisions to which we may be bound, could result in the loss of confidence in us, or result in actions against us by governmental entities, data protection authorities, or others, all of which could result in litigation and financial losses, and could potentially cause us to lose users, advertisers, and revenues. Any of these events could have a material adverse effect on our business, operating results, and financial condition and could cause our stock price to drop significantly.
Changes in how network operators handle and charge for access to data that travel across their networks could adversely impact our business.
We rely upon the ability of our customers to access our service through the internet. If network operators block, restrict, or otherwise impair access to our service over their networks, our service and business could be negatively affected. To the extent that network operators implement usage-based pricing, including meaningful bandwidth caps, or otherwise try to monetize access to their networks by data providers, we could incur greater operating expenses and our customer acquisition and retention could be negatively impacted. Furthermore, to the extent network operators create tiers of internet access service and either charge us for or prohibit us from being available through these tiers, our business could be negatively impacted.
Our services and software may contain undetected software bugs or vulnerabilities, which could manifest in ways that could seriously harm our reputation and our business.
Our services and products like the Loop Player or any other product we may introduce in the future, may contain undetected software bugs, hardware errors, and other vulnerabilities. These bugs and errors can manifest in any number of ways in our products, including through diminished performance, security vulnerabilities, malfunctions, or even permanently disabled products. We plan to update our products from time to time, and as a result some errors in our products may be discovered only after a product has been used by users and may in some cases be detected only under certain circumstances or after extended use. Additionally, many of our products are available on multiple operating systems and/or multiple devices offered by different manufacturers, and changes or updates to such operating systems or devices may cause errors or functionality problems in our products, including rendering our products inoperable by some users. Any errors, bugs, or other vulnerabilities discovered in our code or backend after release could damage our reputation, drive away users, allow third parties to manipulate or exploit our software (including, for example, providing mobile device users a means to suppress advertisements without payment and gain access to features only available to the ad-supported service on tablets and desktop computers), lower revenue, and expose us to claims for damages, any of which could seriously harm our business. Additionally, errors, bugs, or other vulnerabilities may—either directly or if exploited by third parties—affect our ability to make accurate royalty payments.
We could also face claims for product liability, tort, or breach of warranty. Defending a lawsuit, regardless of its merit, is costly and may divert management’s attention and seriously harm our reputation and our business. In addition, if our liability insurance coverage proves inadequate or coverage is unavailable, our business could be seriously harmed.
Interruptions, delays, or discontinuations in service arising from our own systems or from third parties could impair the delivery of our service and harm our business.
We rely on systems housed in our own facilities and upon third parties, including bandwidth providers and third-party “cloud” data storage services, to enable our users to receive our content in a dependable, timely, and efficient manner. We have experienced, and may in the future experience, periodic service interruptions and delays involving our own systems and those of third parties that we work with. Both our own facilities and those of third parties are vulnerable to damage or interruption from earthquakes, floods, fires, power loss, telecommunications failures, and similar events. They are also subject to break-ins, sabotage, intentional acts of vandalism, the failure of physical, administrative, technical, and cyber security measures, terrorist acts, natural disasters, human error, the financial insolvency of third parties that we work with, and other unanticipated problems or events. The occurrence of any of these events could result in interruptions in
38
our services and unauthorized access to, or alteration of, the content and data contained on our systems that these third parties store and deliver on our behalf.
Any disruption in the services provided by these third parties could materially adversely impact our business reputation, customer relations, and operating results. Upon expiration or termination of any of our agreements with third parties, we may not be able to replace the services provided to us in a timely manner or on terms and conditions, including service levels and cost, that are favorable to us, and a transition from one third party to another could subject us to operational delays and inefficiencies until the transition is complete.
User metrics and other estimates could be subject to inherent challenges in measurement, and real or perceived inaccuracies in those metrics may seriously harm and negatively affect our reputation and our business.
We expect to regularly internally review key metrics related to the operation of our business, including metrics related to our active users, premium revenue per user, subscriber numbers, OOH venue locations, and other metrics to evaluate growth trends, service levels, measure our performance, and make strategic decisions. These metrics use or will use internal Company data and will not be validated by an independent third party. While these metrics are expected to be based on reasonable estimates of our user base for the applicable period of measurement, there are inherent challenges in measuring how our services is used across large populations of users and customers. The calculations of our active users may not reflect the actual number of people using our services (if one user has more than one account or if one account is used by multiple users). Errors or inaccuracies in our metrics or data could result in incorrect business decisions and inefficiencies, including expending resources to implement unnecessary business measures or failing to take required actions to attract enough users to satisfy our growth strategies.
In addition, advertisers generally rely on third-party measurement services to calculate metrics related to our advertising business, and these third-party measurement services may not reflect our true audience. Some of our demographic data also may be incomplete or inaccurate because users self-report their names and dates of birth or because we receive them from other third parties. Consequently, the personal data we have may differ from our users’ actual names and ages. If advertisers, partners, or investors do not perceive our user, geographic, or other demographic metrics to be accurate representations of our user base, or if we discover material inaccuracies in our user, geographic, or other demographic metrics, our reputation may be materially harmed.
We are at risk of artificial manipulation of stream counts and failure to effectively manage and remediate such fraudulent streams could have an adverse impact on our business, operating results, and financial condition. Fraudulent streams and potentially associated fraudulent user accounts or artists may cause us to overstate key performance indicators, which once discovered, corrected, and disclosed, could undermine investor confidence in the integrity of our key performance indicators and could cause our stock price to drop significantly.
As we further develop our D2C business, we may in the future be impacted by attempts by third parties to artificially manipulate stream counts. Such attempts may, for example, be designed to generate revenue for rights holders or to influence placement of content on Loop Media-generated curated playlists (“Playlists”) or industry music video charts. These potentially fraudulent streams may involve creating non-bona fide user accounts or artists or using compromised passwords to access legitimate user accounts. We seek to detect fraudulent streams and aim to remove fake user accounts created for the above purposes and filter them out from our metrics on an ongoing basis, as well as to require users to reset passwords that we suspect have been compromised. However, we may not be successful in detecting, removing, and addressing all fraudulent streams and any related user accounts. If in the future we fail to successfully detect, remove, and address fraudulent streams and associated user accounts, it may result in the manipulation of our data, including the key performance indicators, which underlie, among other things, our contractual obligations with rights holders and advertisers (which could expose us to the risk of litigation), as well as harm our relationships with rights holders and advertisers. In addition, once we detect, correct, and disclose fraudulent streams and associated user accounts, this may result in the removal of certain user accounts and/or a reduction in account activity, which may affect key performance indicators and undermine investor confidence in the integrity of our key performance indicators. These could have a material adverse impact on our business, operating results, and financial condition.
39
We are at risk of attempts to manipulate or exploit our software for the purpose of gaining or providing unauthorized access to certain features of our services, and failure to effectively prevent and remediate such attempts could have an adverse impact on our business, operating results, and financial condition.
As our business develops, we may be impacted by attempts by third parties to manipulate or exploit our software for the purpose of gaining or providing unauthorized access to certain features of our services. Third parties may seek to provide mobile device users a means to suppress advertisements without payment and gain access to features only available to the ad-supported services on tablets and desktop computers. If we fail to successfully detect and address such issues, it may have artificial effects on our key performance indicators, which underlie, among other things, our contractual obligations with rights holders and advertisers (which could expose us to the risk of litigation), as well as harm our relationship with rights holders and advertisers. The discovery or development of any new method to gain unauthorized access to certain features of our services, such as through the exploitation of software vulnerabilities, and the sharing of any such method among third parties, may increase the level of unauthorized access (and the attendant negative financial impact described above). We cannot assure you we will be successful in finding ways to effectively address unauthorized access achieved through any such method. Moreover, once we detect and disable such unauthorized access, this may result in the removal of certain user accounts and/or a reduction in account activity, which may affect our key performance indicators and could undermine investor confidence in the integrity of our key performance indicators. These could have a material adverse impact on our business, operating results, and financial condition.
We face risks, such as unforeseen costs, and potential liabilities in connection with content we license and/or distribute through our services.
As a distributor of content, we face potential liability for defamation, negligence, copyright or trademark infringement, right of publicity or privacy claims, misinformation, personal injury torts or other claims based on the nature and content of materials that we license and/or distribute. We also face potential liability for content used in promoting our service, including marketing materials and features on our platforms such as user reviews. Allegations of impropriety, even if unfounded, could have a material adverse effect on our reputation and our business.
To the extent we do not accurately anticipate costs or mitigate risks, or if we become liable for content we license and/or distribute, our business may suffer. Litigation to defend these claims could be costly and the expenses and damages arising from any liability or unforeseen production risks could harm our results of operations. We may not be indemnified to cover claims or costs of these types, and we may not have insurance coverage for these types of claims.
Various regulations as well as self-regulation related to privacy and data security concerns pose the threat of lawsuits, regulatory fines and other liability, require us to expend significant resources, and may harm our business, operating results, and financial condition.
As we collect and utilize personal data about our customers and users as they interact with our services, we are subject to new and existing laws and regulations that govern our use of user data. We are likely to be required to expend significant capital to ensure ongoing compliance with these laws and regulations. Claims or allegations that we have violated laws and regulations relating to privacy and data security could result in negative publicity and a loss of confidence in us by our users and our partners. We may be required to make significant expenditures to resolve these matters and we could be subject to civil liability and/or fines or other penalties, including by government and data protection authorities.
Existing privacy-related laws and regulations in the United States, and in other countries are evolving and are subject to potentially differing interpretations, and various U.S. federal and state or other international legislative and regulatory bodies may expand or enact laws regarding privacy and data security-related matters. Laws coming into effect in various states, adoption of a comprehensive federal data privacy law, and new legislation in international jurisdictions may continue to change the data protection landscape globally and could result in us expending considerable resources to meet these requirements.
40
In the United States, laws and regulations applicable to personal information include industry specific federal legislation, federal and state privacy and consumer protection laws and industry self-regulatory initiatives and frameworks. The California Consumer Privacy Act (CCPA), which came into effect in January 2020, establishes disclosure and transparency rules, and creates new data privacy rights for California residents, including the ability to control how we share their personal information with third parties. The CCPA also provides for civil penalties for violations, as well as a private right of action for data breaches that may increase data breach litigation. The impact of this legislation may require us to modify our data processing practices and policies and incur substantial costs and expenses in an effort to comply. The California Privacy Rights Act (CPRA), which amends the CCPA by enhancing such data privacy rights of California residents and expanding such disclosure and transparency rules, was enacted in November 2020 and goes into full effect in January of 2023. Nevada also enacted a data privacy law in 2020 granting Nevada residents the right to opt out of the sale of their personal information. On March 2, 2021, Virginia enacted the Virginia Consumer Data Protection Act (CDPA) which will go into full effect in January of 2023. We may also be subject to new data protection laws including legislation currently pending in other states including Washington, and New York. We may also from time to time be subject to, or face assertions that we are subject to, additional obligations relating to personal information by contract or due to assertions that self-regulatory obligations or industry standards apply to our practices. Our failure to comply with these data protection laws or any action or suspected security incident may result in governmental actions, fines and non-monetary penalties, or civil liability, which may harm our business. Any expansion of our operations into new markets could result in increased compliance costs to the Company with respect to data privacy regulatory regimes in such other markets.
We may find it necessary or desirable to join self-regulatory bodies or other privacy-related organizations that require compliance with their rules pertaining to privacy and data security. We also may be bound by contractual obligations that limit our ability to collect, use, disclose, share, and leverage user data and to derive economic value from it. New laws, amendments to, or reinterpretations of existing laws, rules of self-regulatory bodies, industry standards, and contractual obligations, as well as changes in our users’ expectations and demands regarding privacy and data security, may limit our ability to collect, use, and disclose, and to leverage and derive economic value from user data. Restrictions on our ability to collect, access and harness user data, or to use or disclose user data, may require us to expend significant resources to adapt to these changes, and would in turn limit our ability to stream personalized content to our users and offer advertising and promotional opportunities to users on the services.
We have incurred, and will continue to incur, expenses to comply with privacy and security standards and protocols imposed by law, regulation, self-regulatory bodies, industry standards, and contractual obligations. Any failure to comply with privacy laws could result in litigation, regulatory or governmental investigations, enforcement action requiring us to change the way we use personal data, restrictions on how we use personal data, or significant regulatory fines. In addition to statutory enforcement, a data breach could lead to compensation claims by affected individuals (including consumer advocacy groups), negative publicity, and a potential loss of business as a result of customers losing trust in us. Such failures could have a material adverse effect on our financial condition and operations.
We rely on advertising revenue to monetize our services, and any failure to convince advertisers of the benefits of advertising on our services in the future could harm our business, operating results, and financial condition.
Our ability to attract and retain advertisers, and ultimately to generate advertising revenue, depends on our ability to, for instance:
| ● | increase the number of hours our ad-supported customers and users spend playing or watching our video content or otherwise engaging with content on our ad-supported service; |
| ● | increase the number of ad-supported customers and users; |
| ● | keep pace with changes in technology and our competitors; |
| ● | compete effectively for advertising dollars with other online and mobile marketing and media companies; |
| ● | maintain and grow our relationships with marketers, agencies, and other demand sources who purchase advertising inventory from us; |
41
| ● | implement and maintain an effective infrastructure for order management; and |
| ● | continue to develop and diversify our advertising platform and offerings, which currently include delivery of advertising products through multiple delivery channels, including traditional computers, mobile, and other connected devices, and multiple content types. |
We may not succeed in capturing a greater share of our advertisers’ core marketing budgets, particularly if we are unable to achieve the scale, reach, products, and market penetration necessary to demonstrate the effectiveness of our advertising solutions, or if our advertising model proves ineffective or not competitive when compared to other alternatives and platforms through which advertisers choose to invest their budgets.
Failure to grow the ad-supported customer and user base and to effectively demonstrate the value of our ad-supported service and other similar offerings on the service to advertisers could result in loss of, or reduced spending by, existing or potential future advertisers, which would materially harm our business, operating results, and financial condition.
Selling advertisements requires that we demonstrate to advertisers that our offerings on the service are effective. For example, we need to show that our ad-supported service has substantial reach and engagement by relevant demographic audiences. Some of our demographic data may be incomplete or inaccurate. For example, because ad-supported users self-report their personal data, which may include their genders and dates of birth, the personal data we have may differ from our ad-supported users’ actual genders and ages. If our ad-supported users provide us with incorrect or incomplete information regarding their personal data, such as genders, age, or other attributes we use to target advertisements to users, or the data are otherwise not available to us, then we may fail to target the correct demographic with our advertising. Advertisers often rely on third parties to quantify the reach and effectiveness of our ad products. These third-party measurement services may not reflect our true audience or the performance of our ad products, and their underlying methodologies are subject to change at any time. In addition, the methodologies we apply to measure the key performance indicators that we use to monitor and manage our business may differ from the methodologies used by third-party measurement service providers, who may not integrate effectively with our ad-supported service. Measurement technologies for mobile devices may be even less reliable in quantifying the reach and usage of our ad-supported service, and it is not clear whether such technologies will integrate with our systems or uniformly and comprehensively reflect the reach, usage, or overall audience composition of our ad-supported service. If such third-party measurement providers report lower metrics than we do, there is wide variance among reported metrics, or we cannot adequately integrate with such services that advertisers require, our ability to convince advertisers of the benefits of our ad-supported service could be adversely affected.
We depend on highly skilled key personnel to operate our business, and if we are unable to attract, retain, and motivate qualified personnel, our ability to develop and successfully grow our business could be harmed.
We believe that our future success is highly dependent on the talents and contributions of our senior management, including Jon Niermann, our Chief Executive Officer, members of our executive team, and other key employees, such as the key technology, product, content, engineering, finance, research and development, marketing, and sales personnel. Many of our employees have unique skills required for and/or historical knowledge of our business. Our future success depends on our continuing ability to attract, develop, motivate, and retain highly qualified and skilled employees. All of our employees, including our senior management, are free to terminate their employment relationship with us at any time, and their knowledge of our business and industry may be difficult to replace. Qualified individuals are in high demand, particularly in the digital media industry, and we may incur significant costs to attract and retain them. We use equity awards to attract talented employees. If the value or liquidity of our common stock declines significantly and remains depressed, that may prevent us from recruiting and retaining qualified employees. If we are unable to attract and retain our senior management and key employees, we may not be able to achieve our strategic objectives, and our business could be harmed. In addition, we believe that our key executives have developed highly successful and effective working relationships. We cannot assure you that we will be able to retain the services of any members of our senior management or other key employees. If one or more of these individuals leave, we may not be able to fully integrate new executives or replicate the current dynamic and working relationships that have developed among our senior management and other key personnel, and our operations could suffer.
42
We have acquired and invested in, and may continue to acquire or invest in, other companies or technologies, which could divert management’s attention and otherwise disrupt our operations and harm our operating results. We may fail to acquire or invest in companies whose market power or technology could be important to the future success of our business.
We acquired substantially all of the assets of Spkr in the fourth quarter of 2020 and acquired all of the outstanding equity of EON Media Group Pte. Ltd. (“EON Media”) in the second quarter of 2021. In the future, we may seek to acquire or invest in, other companies or technologies that we believe could complement or expand our services or enhance our capabilities or content offerings, or otherwise offer growth opportunities. Pursuit of future potential acquisitions or investments may divert the attention of management and cause us to incur various expenses in identifying, investigating, and pursuing suitable opportunities, whether or not they are consummated. In addition, we have limited experience acquiring and integrating other businesses. We may be unsuccessful in integrating our recently acquired businesses or any additional business we may acquire in the future, and we may fail to acquire companies whose market power or technology could be important to the future success of our business.
We also may not achieve the anticipated benefits from any acquisition or investment due to a number of factors, including:
| ● | unanticipated costs or liabilities associated with the acquisition or investment, including costs or liabilities arising from the acquired companies’ failure to comply with intellectual property laws and licensing obligations they are subject to; |
| ● | incurrence of acquisition- or investment-related costs; inability to effectively integrate the assets, operations or personnel related to such acquisitions; |
| ● | diversion of management’s attention from other business concerns; |
| ● | regulatory uncertainties; |
| ● | harm to our existing business relationships with business partners and advertisers as a result of the acquisition or investment; |
| ● | harm to our brand and reputation; |
| ● | the potential loss of key employees; |
| ● | use of resources that are needed in other parts of our business; and |
| ● | use of substantial portions of our available cash to consummate the acquisition or investment. |
If we acquire or invest in other companies, these acquisitions or investments may reduce our operating margins for the foreseeable future. In addition, a significant portion of the purchase price of companies we acquire may be allocated to acquired goodwill, which must be assessed for impairment at least annually. In the future, if our acquisitions or investments do not yield expected returns, we may be required to take charges to our operating results based on this impairment assessment process. Acquisitions or investments could also result in dilutive issuances of equity securities or the incurrence of debt, which could adversely affect our operating results. In addition, if a business we acquire or invest in fails to meet our expectations, our business, operating results, and financial condition may suffer.
Our operating results may fluctuate, which makes our results difficult to predict.
Our revenue and operating results could vary significantly from quarter to quarter and year to year because of a variety of factors, many of which are outside our control. As a result, comparing our operating results on a period-to-period basis may not be meaningful. Factors that may contribute to the variability of our quarterly and annual results include:
43
| ● | our ability to grow our OOH business beyond historic levels through our recently introduced Loop Player, the expansion into more OOH Venues, and the further development of our ad-supported business model; |
| ● | our ability to retain our current user base, increase our number of ad-supported D2C users and Premium subscribers, and increase users’ time spent streaming content on our service; |
| ● | changes in the license payments we are required to make; |
| ● | our ability to maintain licenses required for our business at a commercial price to us; |
| ● | changes in the mix of content that is streamed by our customers, which results in varying license payment amounts being owed; |
| ● | our ability to monetize our service more effectively, particularly as the number of OOH customers and our users on CTVs, mobile and other connected devices grow; |
| ● | our ability to effectively manage our anticipated growth; |
| ● | our ability to attract user and/or customer adoption of and generate significant revenue from new products, services, and initiatives; |
| ● | our ability to attract and retain existing advertisers and prove that our advertising products are effective enough to justify a pricing structure that is profitable for us; |
| ● | the effects of increased competition in our business; |
| ● | our ability to keep pace with changes in technology and our competitors; |
| ● | lack of accurate and timely reports and invoices from our rights holders and partners; |
| ● | interruptions in service, whether or not we are responsible for such interruptions, and any related impact on our reputation; |
| ● | our ability to pursue and appropriately time our entry into new geographic or content markets and, if pursued, our management of this expansion; |
| ● | costs associated with defending any litigation, including intellectual property infringement litigation; |
| ● | the impact of general economic conditions on our revenue and expenses; and |
| ● | changes in regulations affecting our business. |
We have identified material weaknesses in our internal control over financial reporting as of September 30, 2021, and if we fail to implement and maintain effective internal control over financial reporting, our ability to accurately and timely report our financial results could be adversely affected.
We are required to maintain internal control over financial reporting and to report any material weaknesses in those controls. The following material weaknesses in our internal control over financial reporting were identified in the normal course as of September 30, 2021:
| ● | our management had insufficient oversight of the design and operating effectiveness of our disclosure controls and internal controls over financial reporting; |
44
| ● | we failed to maintain effective controls over the period-end financial reporting process, including controls with respect to preparation and disclosure of provision for income taxes, valuation and presentation of asset acquisition, content assets and liabilities, and investments; and |
| ● | we failed to maintain effective controls over journal entries, both recurring and nonrecurring, and account reconciliations and did not maintain proper segregation of duties. |
We have concluded that these material weaknesses arose because we did not have the necessary business processes, systems, personnel, and related internal controls. We began to undertake measures to address material weaknesses in our internal controls with the help of an outside firm, retained in July 2021. We will continue to take steps to remediate these material weaknesses, and we expect improvement in fiscal year 2022.
If we continue to have material weaknesses in our internal control over financial reporting, we may be unable to accurately report our financial results or report them within the timeframes required by law or stock exchange regulations, and we could lose investor confidence in the accuracy and completeness of our financial reports, which would cause the price of our common stock to decline. Under Section 404 of the Sarbanes-Oxley Act, we are required to evaluate and determine the effectiveness of our internal control over financial reporting and provide a management report as to internal control over financial reporting. Failure to maintain effective internal control over financial reporting also could potentially subject us to sanctions or investigations by the SEC, or other regulatory authorities, or stockholder lawsuits, which could require additional financial and management resources. We may be unable to fully remediate previously identified material weaknesses, or we may identify additional material weaknesses in the future, which could materially adversely affect our business, operating results, and financial condition.
Risks Related to Our Intellectual Property
Assertions by third parties of infringement or other violations by us of their intellectual property rights could harm our business, operating results, and financial condition.
Third parties may assert that we have infringed, misappropriated, or otherwise violated their copyrights, patents, trademarks, and other intellectual property rights, and as we face increasing competition, the possibility of intellectual property rights claims against us grows. Our ability to provide our services is dependent upon our ability to license intellectual property rights to audio content, including video music recordings, any musical compositions embodied therein, as well as other visual content and any other media assets that content providers, artists, and/or labels can add or provide. Various laws and regulations govern the copyright and other intellectual property rights associated with audio and visual content, including video music and sound recordings and musical compositions. Existing laws and regulations are evolving and subject to different interpretations, and various legislative or regulatory bodies may expand current or enact new laws or regulations. Although we seek to comply with applicable statutory, regulatory, and judicial frameworks by, for example, entering into license agreements, we may unknowingly be infringing or violating any third-party intellectual property rights, or may do so in the future. Moreover, while we may often be able to seek indemnities from our licensors with respect to infringement claims that may relate to the content, they provide to us, such indemnities may not be sufficient to cover the associated liability if the licensor at issue does not have adequate financial resources.
In addition, music, internet, technology, and media companies are frequently subject to litigation based on allegations of infringement, misappropriation, or other violations of intellectual property rights. Many companies in these industries have substantially larger patent and intellectual property portfolios than we do, which could make us a target for litigation. We may not be able to assert counterclaims against parties that sue us for patent, or other intellectual property infringement. In addition, various “non-practicing entities” that own patents and other intellectual property rights often attempt to aggressively assert claims in order to extract value from technology companies. Further, from time to time we may introduce new products and services, including in territories where we currently do not have an offering, which could increase our exposure to patent and other intellectual property claims from competitors and non-practicing entities. Assertions of third-party intellectual property rights or any infringement or misappropriation claims arising from such assertions could substantially harm our business, operating results, and financial condition. If we are forced to defend against any infringement or misappropriation claims, whether they are with or without merit, are settled out of court, or are determined in our favor, we may be required to expend significant time and financial resources on the defense of such
45
claims, and such claims also would divert management time and attention from our business operations. Furthermore, an adverse outcome of a dispute may require us to pay significant damages, which may be even greater if we are found to have willfully infringed upon a party’s intellectual property; cease exploiting copyrighted content that we have previously had the ability to exploit; cease using solutions that are alleged to infringe or misappropriate the intellectual property of others; expend additional development resources to redesign our solutions; enter into potentially unfavorable royalty or license agreements in order to obtain the right to use necessary technologies, content, or materials; indemnify our partners and other third parties; and/or take other actions that may have material effects on our business, operating results, and financial condition.
Failure to protect our intellectual property could substantially harm our business, operating results, and financial condition.
The success of our business depends on our ability to protect and enforce our patents, trade secrets, trademarks, copyrights, and all of our other intellectual property rights, including our intellectual property rights underlying our services. We attempt to protect our intellectual property under patent, trade secret, trademark, and copyright law through a combination of intellectual property registration, employee, third-party assignment and nondisclosure agreements, other contractual restrictions, technological measures, and other methods. These afford only limited protection, and we are still continuing to develop our processes for securing our intellectual property rights. Despite our efforts to protect our intellectual property rights, unauthorized parties may attempt to copy aspects of our product and brand features or obtain and use our trade secrets and other confidential information. Moreover, policing our intellectual property rights is difficult and time-consuming. We cannot assure you that we would have adequate resources to protect and police our intellectual property rights, and we cannot assure you that the steps we take to do so will always be effective.
We have filed, and may in the future file, patent applications on certain of our innovations. It is possible, however, that these innovations may not be patentable. In addition, given the cost, effort, risks, and downside of obtaining patent protection, including the requirement to ultimately disclose the invention to the public, we may choose not to seek patent protection for some innovations. Furthermore, our patent applications may not issue as granted patents, the scope of the protection gained may be insufficient, or an issued patent may be deemed invalid or unenforceable. Any of our present or future patents or other intellectual property rights may lapse or be invalidated, circumvented, challenged, or abandoned. Our intellectual property rights also may not provide competitive advantages to us. Our ability to assert our intellectual property rights against potential competitors or to settle current or future disputes could be limited by our relationships with third parties, and any of our pending or future patent applications may not have the scope of coverage originally sought. Our intellectual property rights may not be enforced in jurisdictions where competition may be intense or where legal protection may be weak. We could lose both the ability to assert our intellectual property rights against, or to license our technology to, others and the ability to collect royalties or other payments.
We currently own the www.loop.tv internet domain name and various other related domain names. Internet regulatory bodies generally regulate domain names. If we lose the ability to use a domain name in a particular country, we may be forced either to incur significant additional expenses to market our services within that country or, in extreme cases, to elect not to offer our services in that country. Either result could harm our business, operating results, and financial condition. The regulation of domain names in the United States and in foreign countries is subject to change. Regulatory bodies could establish additional top-level domains, appoint additional domain name registrars, or modify the requirements for holding domain names. As a result, we may not be able to acquire or maintain the domain names that utilize our brand names in the United States or other countries in which we may conduct business in the future.
Litigation or proceedings before governmental authorities and administrative bodies may be necessary in the future to enforce our intellectual property rights, to protect our patent rights, trademarks, trade secrets, and domain names and to determine the validity and scope of the proprietary rights of others. Our efforts to enforce or protect our proprietary rights may be ineffective and could result in substantial costs and diversion of resources and management time, each of which could substantially harm our operating results. Additionally, changes in law may be implemented, or changes in the interpretation of such laws may occur, that may affect our ability to protect and enforce our patents and other intellectual property.
46
Risks Related to Owning Our Common Stock
The trading price of our common stock has been and will likely continue to be volatile.
The trading price of our common stock has been and is likely to continue to be volatile. The market price of our common stock may fluctuate or decline significantly in response to numerous factors, many of which are beyond our control, including:
| ● | the number of shares of our common stock publicly owned and available for trading; |
| ● | quarterly variations in our results of operations or those of our competitors; |
| ● | the accuracy of any financial guidance or projections; |
| ● | our actual or anticipated operating performance and the operating performance of similar companies in the music video, OOH entertainment, or digital media spaces; |
| ● | our announcements or our competitors’ announcements regarding new services, enhancements, significant contracts, acquisitions, or strategic investments; |
| ● | general economic conditions and their impact on advertising spending; |
| ● | the overall performance of the equity markets; |
| ● | threatened or actual litigation; |
| ● | changes in laws or regulations relating to our service; and |
| ● | sales or expected sales of our common stock by us, and our officers, directors, and stockholders. |
In addition, the stock market in general, and the market for small media companies, have experienced extreme price and volume fluctuations that often have been unrelated or disproportionate to the operating performance of those companies. Securities class action litigation has often been instituted against companies following periods of volatility in the overall market and in the market price of a company’s securities. Such litigation, if instituted against us, could result in very substantial costs, divert our management’s attention and resources and harm our business, operating results, and financial condition.
Because of their significant ownership of our common stock, our founders and other large investors have substantial control over our business, and their interests may differ from our interests or those of our other stockholders.
As of December 27, 2021, our two co-founders (Jon Niermann and Liam McCallum) and our largest non-employee investor (Bruce Cassidy) beneficially owned or controlled, directly or indirectly, common stock representing 35.8% of the combined voting power of all our outstanding voting securities. As a result of their ownership or control of our voting securities, if our founders and/or significant stockholders act together, they will have significant control over the outcome of substantially all matters submitted to our stockholders for approval, including the election of directors. This may delay or prevent an acquisition or cause the trading price of our common stock to decline. Our founders may have interests different from yours. Therefore, the concentration of voting power among our founders may have an adverse effect on the price of our common stock.
47
Sales of substantial amounts of our common stock in the public markets by our co-founders or other stockholders, or the perception that such sales might occur, could reduce the price that our common stock might otherwise attain.
Sales of substantial amounts of our common stock in the public market by our founders, affiliates, or non-affiliates, or the perception that such sales could occur, could adversely affect the trading price of our common stock, and may make it more difficult for you to sell your common stock at a time and price that you deem appropriate. We are unable to predict the effect that such sales may have on the prevailing price of our common stock.
If securities or industry analysts publish inaccurate or unfavorable research about our business or cease publishing research about our business, our share price and trading volume could decline.
The trading market for our common stock will be influenced by the research and reports that securities or industry analysts publish about our Company, if any do so in the future. If one or more of the analysts who may cover us in the future downgrade our common stock or publish inaccurate or unfavorable research about our Company, our common stock price would likely decline. If no securities or industry analysts commence coverage of our Company, the trading price of our shares would likely be negatively impacted. Further, if one or more of these analysts, once they cover us, cease coverage of our Company or fail to publish reports on us regularly, demand for our common stock could decrease, which might cause our common stock price and trading volume to decline.
The requirements of being a public company may strain our resources and divert management’s attention.
We are subject to the reporting requirements of the Securities Exchange Act of 1934, as amended (the “Exchange Act”), the Sarbanes-Oxley Act, and other applicable securities rules and regulations. Compliance with these rules and regulations incurs substantial legal and financial compliance costs, makes some activities more difficult, time-consuming, or costly, and places increased demand on our systems and resources. The Exchange Act requires, among other things, that we file annual and current reports with respect to our business and operating results. The Sarbanes-Oxley Act requires, among other things, that we maintain effective disclosure controls and procedures and internal control over financial reporting. To maintain disclosure controls and procedures and internal control over financial reporting that meet this standard, significant resources and management oversight are required. As a result, management’s attention may be diverted from other business concerns, which could harm our business and operating results.
We do not expect to declare any dividends in the foreseeable future.
We have never declared or paid any cash dividends on our share capital. The continued operation of our business will require substantial cash, and we currently intend to retain any future earnings for working capital and general corporate purposes. Accordingly, we do not anticipate paying any cash dividends to holders of our common stock at any time in the foreseeable future. Any determination to pay future dividends will be at the discretion of our Board of Directors and will depend upon our results of operations, financial condition, contractual restrictions, indebtedness, restrictions imposed by applicable law and other factors our Board of Directors deems relevant. There is no guarantee that your shares of common stock will appreciate in value or even maintain the price at which you purchased your shares of common stock, and you may lose the entire amount of your investment.
Exercise of warrants, and issuance of incentive stock grants may have a dilutive effect on our stock, and negatively impact the price of our common stock.
As of December 27, 2021, we had 15,464,700 warrants outstanding at a weighted average exercise price of $1.63 per share. We are able to grant stock options, restricted stock, restricted stock units, stock appreciation rights, bonus stocks, and performance awards under The Loop Media, Inc. Amended and Restated 2020 Equity Incentive Compensation Plan (the “2020 Equity Incentive Plan”). Under the 2020 Equity Incentive Plan, 1,667,751 shares of common stock are reserved and authorized to be issued as of December 27, 2021, and 18,744,556 shares were issuable upon the exercise of outstanding options at a weighted average exercise price of $1.10 per share.
48
To the extent that any of the outstanding warrants and options described above are exercised, dilution to the interests of our stockholders may occur. For the life of such warrants and options, the holders will have the opportunity to profit from a rise in the price of the common stock with a resulting dilution in the interest of the other holders of common stock. The existence of such warrants and options may adversely affect the market price of our common stock and the terms on which we can obtain additional financing, and the holders of such warrants and options can be expected to exercise them at a time when we would, in all likelihood, be able to obtain additional capital by an offering of our unissued capital stock on terms more favorable to us than those provided by such warrants and options.
49
ITEM 1B. UNRESOLVED STAFF COMMENTS.
We are a smaller reporting company as defined by Rule 12b-2 of the Exchange Act and are not required to provide the information under this item.
ITEM 2. PROPERTIES.
Our principal executive offices are located at 700 N. Central Avenue, Suite 430, Glendale, CA, and our telephone number is (213) 436-2100. We currently lease approximately 1,976 square feet of office space at this location. The lease term is 43 months from November 14, 2019 to May 31, 2023.
We also have an office located at 150 Nickerson Street, Suite 305, Seattle, WA 98109. We currently lease approximately 3,776 square feet of office space at this location. The lease term is 60 months, from January 1, 2018 to December 31, 2022.
We believe that our leased facilities are adequate to meet our needs at this time. We do not currently own any real property.
ITEM 3. LEGAL PROCEEDINGS.
We are currently not involved in any litigation that we believe could have a material adverse effect on our financial condition or results of operations. There is no action, suit, proceeding, inquiry, or investigation before or by any court, public board, government agency, self-regulatory organization or body pending or, to the knowledge of the executive officers of our Company, threatened against or affecting our Company, or our common stock, in which we believe an adverse decision could have a material adverse effect.
ITEM 4. MINE SAFETY DISCLOSURES.
Not applicable.
50
PART II
ITEM 5. MARKET FOR REGISTRANTS’S COMMON EQUITY, RELATED STOCKHOLDER MATTERS AND ISSUER PURCHASES OF EQUITY SECURITIES.
Market Information
Our common stock is quoted under the symbol “LPTV” on the Pink Open Market operated by OTC Markets Group, Inc.
The following table sets forth the range of high and low bid quotations for our common stock for each of the periods indicated as reported by the Pink Open Market. These quotations reflect inter-dealer prices, without retail mark-up, mark-down or commission and may not necessarily represent actual transactions. Our common stock is very thinly traded and, thus, pricing of our common stock on the Pink Open Market does not necessarily represent its fair market value. The information in the table below has been adjusted to give retroactive effect to the Reverse Split that we effected on June 8, 2020.
Nine Months Ended September 30, 2021 |
| |||
| ||||
Quarter Ended |
| High $ |
| Low $ |
March 31, 2021 |
| 3.05 |
| 2.875 |
June 30, 2021 |
| 2.60 |
| 2.50 |
September 30, 2021 |
| 2.45 |
| 2.45 |
Twelve Months Ended December 31, 2020 |
| |||
| ||||
Quarter Ended |
| High $ |
| Low $ |
March 31, 2020 |
| 0.78 |
| 0.54 |
June 30, 2020 |
| 2.55 |
| 2.25 |
September 30, 2020 |
| 2.05 |
| 2.00 |
December 31, 2020 | 3.21 | 3.21 |
On December 27, 2021, the closing price of our common stock as quoted on Pink Open Market was $2.35.
Holders
As of December 27, 2021, we had 133,470,141 shares of common stock outstanding held by approximately 238 stockholders of record.
Dividends
We have never declared or paid cash dividends on our common stock. We intend to retain all available funds and any future earnings, if any, to fund the development and expansion of our business and we do not anticipate paying any cash dividends in the foreseeable future. Any future determination related to dividend policy will be made at the discretion of our board of directors.
Securities Authorized for Issuance under Equity Compensation Plans
Information regarding our equity compensation plans is contained in Item 12 under “Security Ownership of Certain Beneficial Owners and Management and Related Stockholder Matters – Equity Compensation Plan Information” and “Note 16 — Stock Options and Warrants” to our Consolidated Financial Statements.
51
ITEM 6. [RESERVED]
ITEM 7. MANAGEMENT’S DISCUSSION AND ANALYSIS OF FINANCIAL CONDITION AND RESULTS OF OPERATIONS.
STATEMENT ON FORWARD-LOOKING INFORMATION
This Transition Report contains certain forward-looking statements. All statements other than statements of historical fact are “forward-looking statements” for purposes of these provisions, including any projections of earnings, revenues, or other financial items; any statements of the plans, strategies, and objectives of management for future operations; any statements concerning proposed new products, services, or developments; any statements regarding future economic conditions or performance; statements of belief; and any statement of assumptions underlying any of the foregoing. Such forward-looking statements are subject to inherent risks and uncertainties, and actual results could differ materially from those anticipated by the forward-looking statements.
These forward-looking statements involve significant risks and uncertainties, including, but not limited to, the following: competition, promotional costs, and risk of declining revenues. Our actual results could differ materially from those anticipated in such forward-looking statements as a result of a number of factors. These forward-looking statements are made as of the date of this filing, and we assume no obligation to update such forward-looking statements. The following discusses our financial condition and results of operations based upon our financial statements which have been prepared in conformity with accounting principles generally accepted in the United States of America. It should be read in conjunction with our financial statements and the notes thereto included elsewhere herein.
Overview
We are a multichannel digital video platform media company that uses marketing technology, or “MarTech,” to generate our revenue and offer our services. Our technology and vast library of videos and licensed content enables us to curate and deliver short-form videos to our out-of-home (“OOH”) dining, hospitality, retail and other customers to enable them to inform, entertain and engage their customers. Our technology provides OOH customers and third-party advertisers with a targeted marketing and promotional tool for their products and services and allows us to measure the number of potential viewers of such advertising and promotional materials. In addition to providing services to OOH venue operators, we provide our services direct to consumers in their homes and on their mobile devices.
We offer self-curated music video content licensed from major and independent record labels, as well as movie, television and video game trailers, kid-friendly videos, viral videos, drone footage, news headlines, and lifestyle and atmospheric channels. We believe we are the only service in the United States that has OOH and D2C licenses with all three major music labels, Universal Music, Sony Music and Warner Music Group (collectively, the “Music Labels”). These licenses allow us to provide music video content in both the OOH and D2C markets. Our OOH services are complimented by our mobile app (the “Loop App”), which allows users to follow each other, share their locations and playlists, view activity, and signal support for a music video.
We curate content into playlists for OOH locations and into streaming channels for delivery to our over-the-top (“OTT”) platform customers and our mobile application users. Our digital platform service seeks to surround and engage consumers with a diverse offering of video content on their chosen digital screen wherever they are located. Our services include both out ad-supported service, which offers content on a free or unpaid advertising supported basis, and our premium service, which offers content on a paid subscription basis. We deliver our service to OOH venues primarily through our proprietary Loop Media-designed “small-box” streaming Android media player (the “Loop Player”) and direct to consumers primarily through our fully functional and operational Loop App and across OTT streaming platforms on connected TVs (“CTVs”).
52
Off-Balance Sheet Arrangements
We have no off-balance sheet arrangements.
Recent Developments
Impact of COVID-19
The spread of COVID-19 around the world is continuing to affect the United States and global economies and has affected our operations and those of third parties on which we rely, including by causing disruptions in staffing, order fulfillment, and demand for product. In addition, the COVID-19 pandemic has and may continue to affect our revenue significantly in 2022. In particular, many OOH venues have closed or limited their public capacity, which may impact their willingness to invest in on-site entertainment, such as our services. Additionally, while the potential economic impact brought by, and the duration of, the COVID-19 pandemic is difficult to assess or predict, the impact of the COVID-19 pandemic on the global financial markets may reduce our ability to access capital, which could negatively impact our short-term and long-term liquidity. The continuing impact of the COVID-19 pandemic in 2022 is highly uncertain and subject to change.
As COVID-19 continues to evolve, the extent to which COVID-19 impacts operations will depend on future developments, which are highly uncertain and cannot be predicted with confidence, including the duration and severity of the outbreak, and the actions that may be required to try and contain COVID-19 or treat its impact. We continue to monitor the pandemic and, the extent to which the continued spread of the virus adversely affects our customer base and therefore revenue. As the COVID-19 pandemic is complex and rapidly evolving, our plans as described above may change. At this point, we cannot reasonably estimate the duration and severity of this pandemic, which could have a material adverse impact on our business, results of operations, financial position and cash flows.
Our Revenue Model
Our ad-supported and subscription-based services are separate offerings but work together to support our business. Given the expected growth in the digital OOH advertising market, coupled with the preferable economics to the Company of an ad-supported business model, we encourage our customers to choose our ad-supported services over our subscription services. While our ad-supported service is generally associated with higher margins, we provide our premium subscription service for OOH customers that are seeking an ad-free content offering.
MarTech
MarTech, the intersection of marketing and technology leverages data and analytics to expand our points of distribution and advertising revenue.
Distribution. Our current customer acquisition strategy is focused on marketing our Loop Player to businesses through social media and other online mediums. We seek to optimize our customer acquisition and the distribution of our Loop Players by analyzing various data, including our return on marketing investments. When analyzing the success of our marketing investments, we examine the number of sales leads obtained from online platforms and the conversion of leads into high quality customers. We regularly analyze the engagement with, and success of, our creative advertising content and modify our messaging to improve customer acquisition.
Advertising Revenue. We intend to increase revenue by leading with programmatic advertising, an automated measurement process that manages the sales of our advertising inventory. Today, most digital advertising is programmatic advertising, with digital OOH advertising comprising a small portion of the overall market. While we strive to establish direct advertising deals with advertisers, a significant part of our current advertising revenue is purposely secured through programmatic advertising. Our yield optimization strategies look to leverage data analytic and other techniques to maximize the value of our digital advertising inventory. We intend to optimize the combination of our ad impressions, cost per impression and the percentage of our ad inventory filled by advertisers, while balancing our customers’ experience
53
by limiting the number of ads delivered during any given period. Our Loop Player is designed to allow us to multiply OOH revenue in certain locations, as outlined below:
54
Loop Player
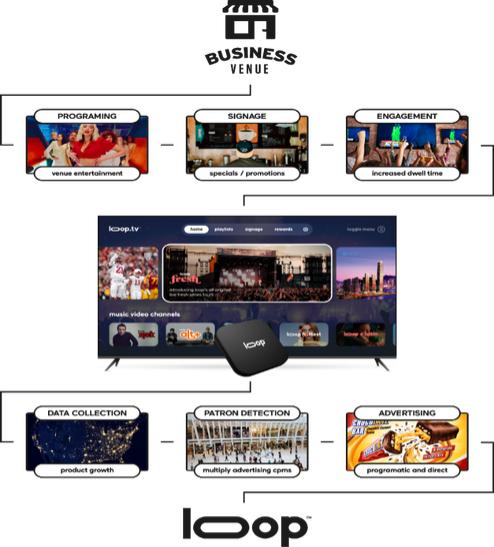
The Loop Player is at the heart of our revenue model and its technology enables us to communicate and interact with OOH locations, advertisers, and OOH customers:
| ● | OOH Locations. The Loop Player allows OOH customers to program their in-store monitors and audio systems to schedule playlists depending on the time of day, promote their products or services through digital signage and deliver company-wide messages to staff in back-office locations. Business owners can filter content based on ratings or explicit language and can control the genres of videos in their programs. The Loop Player caches and encrypts our content, thereby supplying uninterrupted play for up to 12 hours in the event of an internet disruption. |
| ● | Advertising and Content Partners. Our Loop Player works with our technology, software and servers to determine the number of ad impressions available for programmatic advertising, which can be filled in real-time, seconds before ads are played. Our Loop Player delivers content and advertising to venues and our technology allows us to record and report video content played (for reporting to content providers) and advertising content played (for reporting to our advertising demand partners and advertisers). In particular, our technology allows us to track when, where and how long content is played, and measure approximately how many consumers were in position to view the content or advertisement. The Loop Player’s Wi-Fi and Bluetooth capabilities allow us to determine the number of potential viewers at a given location, which can provide us with a revenue multiplier, as we are able to increase advertising revenue at high-volume locations. This “multiplier effect” is possible due to the Loop Player’s ability to detect, using Bluetooth and Wi-Fi technology, the number of consumer mobile devices within reach of a Loop Player in an OOH location which provides advertisers with a proxy for the number of potential viewers of a particular ad at any given time. |
| ● | OOH Customers. We are seeking to further develop the interactivity between the Loop Player and the customers in OOH venues. This may take different forms, such as offering a simple thumbs up or thumbs down function, displaying the number of customer votes for a given piece of content, and downloading of |
55
| menus from the screens and other functions. This will require further development of our mobile application in the future. |
| ● | Loop Media. We are able to consistently monitor the preferences of the customers of our OOH customers and venue operators through our Loop Player. Our Loop Player allows us to collect specific information and data on content played, views, location, and location type, enabling us to effectively measure demand. These capabilities allow us to make informed decisions around which type of content to acquire or develop, as well as identify new market opportunities. |

Key Performance Indicator
We review our quarterly active users (“QAU”), among other key performance indicators, to evaluate our business, measure our performance, identify trends affecting our business, formulate financial projections and make strategic decisions. We define an “active user” as a Loop Player (or OOH venue-owned computer screening our content), using either the ad-supported or subscription service, that is online, playing content, and has checked into the Loop analytics system at least once in the past 90-day period; and QAU refers to the number of such users that were online during the such period. Increases or decreases in our QAU may not correspond with increases or decreases in our revenue, and QAU may be calculated in a manner different than any similar key performance indicator used by other companies.
For the quarter ended September 30, 2021, QAU was 5,791, compared to 4,296 for the quarter ended June 30, 2021, a 34% increase. We did not record QAUs prior to June 30, 2021.
Components of results of operations
Revenue
Revenue generated from content and streaming services, including content encoding and hosting, are recognized over the term of the service based on bandwidth usage. The revenue generated from content subscription services in customized formats is recognized over the term of the service. The revenue generated from hardware for ongoing subscription content delivery is recognized at the point of the hardware delivery.
Cost of Revenue
Cost of revenue consists of expenses related to licensing, content delivery and customer support.
56
Significant expenses include employee compensation and related costs for support team members, including salaries, benefits, and stock-based compensation, as well as hardware costs, certain data center and facility costs.
Operating Expenses
Operating expenses support the general overhead related to all the products and services that we provide to our customers and, as a result, they are presented in an aggregate total.
Sales, General and Administrative Expenses
Sales and marketing expenses consist primarily of employee compensation and related costs associated with our sales and marketing staff, including salaries, benefits, bonuses, commissions as well as costs relating to our marketing and business development. We intend to continue to invest resources in our sales and marketing initiatives to drive growth and extend our market position.
General and administrative expenses consist of employee compensation and related costs for executive, finance, legal, human resources, recruiting, and employee-related information technology and administrative personnel, including salaries, benefits, bonuses and, depreciation, facilities, recruiting and other corporate services.
Impairment of goodwill and intangibles
Goodwill impairment occurs when the carrying amount of a goodwill asset is greater than its fair value. The amount of the impairment is the difference between the two figures. Goodwill is recorded as part of a corporate acquisition, representing the excess of the price paid over the value of the underlying assets and liabilities of the acquiree.
Other Income/Expense
Interest expense
Interest expense consists of interest expense on our outstanding indebtedness and amortization of debt issuance costs.
Income taxes
We account for income taxes in accordance with ASC Topic 740, Income Taxes. ASC 740 requires a company to use the asset and liability method of accounting for income taxes, whereby deferred tax assets are recognized for deductible temporary differences, and deferred tax liabilities are recognized for taxable temporary differences. Temporary differences are the differences between the reported amounts of assets and liabilities and their tax bases. Deferred tax assets are reduced by a valuation allowance when, in the opinion of management, it is more likely than not that some portion, or all of, the deferred tax assets will not be realized. Deferred tax assets and liabilities are adjusted for the effect of changes in tax laws and rates on the date of enactment.
Under ASC 740, a tax position is recognized as a benefit only if it is “more likely than not” that the tax position would be sustained in a tax examination, with a tax examination being presumed to occur. The amount recognized is the largest amount of tax benefit that is greater than 50% likely of being realized on examination. For tax positions not meeting the “more likely than not” test, no tax benefit is recorded. We have no material uncertain tax positions for any of the reporting periods presented.
See our discussion in “Note 2 – Summary of Significant Accounting Policies” in our Consolidated Financial Statements included in Item 15 of this Transition Report.
57
Change in Fiscal Year
On November 12, 2021, our Board of Directors approved a change in our fiscal year end from December 31 to September 30. As a result, our results of operations, cash flows and all transactions impacting shareholders equity presented in this Transition Report are for the nine months ended September 30, 2021, and our fiscal year 2020 are for the twelve months ended December 31, 2020, unless otherwise noted. As such, our fiscal year 2021, or fiscal 2021, refers to the period from January 1, 2021, to September 30, 2021. This Transition Report also includes an unaudited consolidated statement of operations for the comparable stub period of January 1, 2020 to September 30, 2020. See our discussion in “Note 2 – Summary of Significant Accounting Policies” in our Consolidated Financial Statements included in Item 15 of this Transition Report for additional information. The discussion below provides a comparison for the nine-month transition period ended September 30, 2021, to the nine-month stub period ended September 30, 2020. All information for the nine-month period ended September 30, 2020, is unaudited.
Consolidated Results of Operations
The following tables set forth our results of operations for the periods presented. The period-to-period comparison of financial results is not necessarily indicative of future results:
Nine months ended | Nine months ended | |||||||||||
September 30, | September 30, | |||||||||||
| 2021 |
| 2020 |
| $variance |
| % variance |
| ||||
Total revenue |
| 4,363,982 |
| 2,088,913 |
| 2,275,069 |
| 109 | % | |||
Cost of revenue |
| 3,910,744 |
| 647,337 |
| 3,263,407 |
| 504 | % | |||
Gross profit |
| 453,238 |
| 1,441,576 |
| (988,338) |
| (69) | % | |||
Total operating expenses |
| 25,908,026 |
| 6,456,975 | 19,451,051 | 301 | % | |||||
Loss from operations |
| (25,454,788) |
| (5,015,399) | (20,439,389) | 408 | % | |||||
Other income (expense): |
|
|
| |||||||||
Interest income |
| 7,127 |
| 3,556 |
| 3,571 |
| 100 | % | |||
Interest expense |
| (1,294,648) |
| (739,698) |
| (554,950) |
| 75 | % | |||
Inducement expense |
| — |
| (3,793,406) |
| 3,793,406 |
| (100) | % | |||
Deemed dividend |
| — |
| (3,800,000) |
| 3,800,000 |
| (100) | % | |||
Change in fair value of derivatives | 159,017 | — | 159,017 | N/A | % | |||||||
Gain/(Loss) on extinguishment of debt, net |
| 564,481 |
| — |
| 564,481 |
| N/A | % | |||
Other income | — | 10,000 | (10,000) | (100) | % | |||||||
Gain/(loss) on foreign currency translation |
| 4,279 |
| — |
| 4,279 |
| N/A | % | |||
Total other income (expense) |
| (559,744) |
| (8,319,548) |
| 7,759,804 |
| (93) | % | |||
Provision for income taxes | 716,260 |
| — |
| 716,260 |
| N/A | % | ||||
Net loss | $ | (25,298,272) | $ | (13,334,947) | $ | (11,963,325) |
| 90 | % | |||
Revenues
The Company’s revenue increased for the nine months ended September 30, 2021, from 2020 by $2,275,069, or 109%, primarily due to an additional three months of revenue and an increase in advertising revenue because of the adoption of our ad supported OOH business strategy and an increase in the number of players installed. Subscription revenues also increased due to new customer activation and customers reopening from the pandemic.
Cost of revenue
Cost of revenue increased 504% from $647k in 2020 to $3.9m in 2021. The $3,263,407 increase in cost of revenues for the nine months ended September 30, 2021, from 2020 was primarily due to an increase in licensing costs as a result of increased use of royalty content and usage.7 The Company’s content license costs were recognized in the nine
58
months ended September 30, 2021, not in 2020. In addition, our network infrastructure and server hosting costs increased due to an increased use of all products.
Total operating expenses
Operating expenses increased $19,451,051 due to various expenses, including stock compensation of $8,158,013. Amortization was $1,109,834 due to intangibles, primarily due to the acquisition of Eon (see “Note 3 – Business Combination” to our Consolidated Financial Statements). The Spkr Inc. technology intangible and the Eon brand name intangible remaining net amortizable value was charged to impairment for $1,405,142 and $2,251,513, respectively, during the nine months ended September 30, 2021. The Company charged $4,442,487 to goodwill impairment for the nine months ended September 30, 2021.
Other income and (expenses)
Other income and expenses decreased 93%, $7,759,804 primarily due to the deemed dividend and inducement expense from the prior period. For the nine months ended September 30, 2020, we recognized an inducement expense equal to the excess of the allocated fair value of the Series B Convertible preferred stock and the carrying value of the loan payable as of the date the inducement offers were accepted. The excess of the fair value of the Series B Convertible preferred stock over the carrying value of the loan payable was $3,793,406. There was a deemed dividend in 2020 of $3,800,000. See Note 2 – Summary of Significant Accounting Policies and Note 12 Convertible Debentures, for discussion regarding derivatives.
EBITDA and Adjusted EBITDA
We believe that the presentation of EBITDA and Adjusted EBITDA, financial measures that are not part of U.S. Generally Accepted Accounting Principles, or U.S.GAAP, provides investors with additional information about our financial results. EBITDA and Adjusted EBITDA are important supplemental measures used by our board of directors and management to evaluate our operating performance from period-to-period on a consistent basis and as a measure for planning and forecasting overall expectations and for evaluating actual results against such expectations.
We define EBITDA as earnings before interest expense (income), income tax (expense)/benefit, depreciation and amortization.
We define Adjusted EBITDA as earnings before interest expense (income), income tax (expense)/benefit, depreciation and amortization, adjusted for stock-based compensation and other non-recurring income and expenses, if any.
EBITDA is not measured in accordance with, or an alternative to, measures prepared in accordance with U.S. GAAP. In addition, this non-GAAP measure is not based on any comprehensive set of accounting rules or principles. As a non-GAAP measure, EBITDA has limitations in that it does not reflect all of the amounts associated with our results of operations as determined in accordance with U.S. GAAP. In particular:
| ● | EBITDA does not reflect the amounts we paid in interest expense on our outstanding debt; |
| ● | EBITDA does not reflect the amounts we received in interest income by our investors; |
| ● | EBITDA does not reflect the amounts we received in interest income on our investments; |
| ● | EBITDA does not reflect the amounts we paid in taxes or other components of our tax provision; |
| ● | EBITDA does not include depreciation expense from fixed assets; and |
| ● | EBITDA does not include amortization expense. |
59
Because of these limitations, you should consider EBITDA alongside other financial performance measures including net income (loss) and our financial results presented in accordance with U.S. GAAP.
The following table provides a reconciliation of net loss to EBITDA for each of the periods indicated:
The following table provides a reconciliation of net loss to EBITDA for each of the years indicated:
| Nine months ended |
| Nine months ended |
| |||
GAAP net loss | $ | (25,298,272) | $ | (13,334,947) | |||
Adjustments to reconcile to EBITDA: | |||||||
Interest expense | $ | 1,294,648 | $ | 739,698 | |||
Interest income | $ | (7,127) | $ | (3,556) | |||
Amortization and Depreciation expense* | $ | 2,046,532 | $ | 728,990 | |||
Income Tax expense / (benefit) | $ | (716,260) | $ | — | |||
EBITDA | $ | (22,680,479) | $ | (11,869,815) | |||
*Includes amortization of content license assets.
Adjusted EBITDA
Adjusted EBITDA is not measured in accordance with, or an alternative to, measures prepared in accordance with U.S. GAAP. In addition, this non-GAAP measure is not based on any comprehensive set of accounting rules or principles. As a non-GAAP measure, Adjusted EBITDA has limitations in that it does not reflect all of the amounts associated with our results of operations as determined in accordance with U.S. GAAP. In particular:
| ● | Adjusted EBITDA does not reflect the amounts we paid in interest expense on our outstanding debt; |
| ● | Adjusted EBITDA does not reflect the amounts we paid in taxes or other components of our tax provision; |
| ● | Adjusted EBITDA does not include depreciation expense from fixed assets; |
| ● | Adjusted EBITDA does not include amortization expense; |
| ● | Adjusted EBITDA does not include the impact of stock-based compensation; and |
| ● | Adjusted EBITDA does not include the impact of non-recurring income and expenses. |
Because of these limitations, you should consider Adjusted EBITDA alongside other financial performance measures including net income (loss) and our financial results presented in accordance with U.S. GAAP.
60
The following table provides a reconciliation of net loss to Adjusted EBITDA for each of the periods indicated:
| Nine months ended |
| Nine months ended |
| |||
GAAP net loss | $ | (25,298,272) | $ | (13,334,947) | |||
Adjustments to reconcile to Adjusted EBITDA: | |||||||
Interest expense | $ | 1,294,648 | $ | 739,698 | |||
Interest income | $ | (7,127) | $ | (3,556) | |||
Amortization and Depreciation expense * | $ | 2,046,532 | $ | 728,990 | |||
Income Tax expense / (benefit) | $ | (716,260) | $ | 0 | |||
Stock-based compensation | $ | 8,158,013 | $ | 1,816,034 | |||
Non recurring (income) / expense | $ | 8,818,830 | $ | 0 | |||
Adjusted EBITDA | $ | (5,703,636) | $ | (10,053,781) | |||
*Includes amortization content license assets.
Liquidity and Capital Resources
As of September 30, 2021, the Company had cash of approximately $4,162,548. The following table provides a summary of the Company’s net cash flows from operating, investing, and financing activities.
| ||||||
Nine months ended | Twelve months ended | |||||
| September 30, |
| December 31, | |||
2021 | 2020 | |||||
Net cash used in operating activities | $ | (7,162,546) | $ | (5,933,667) | ||
Net cash provided by investing activities |
| (774,937) |
| (752,027) | ||
Net cash provided by financing activities |
| 11,261,871 |
| 6,512,410 | ||
Change in cash |
| 3,324,387 |
| (173,284) | ||
Cash, beginning of period |
| 838,161 |
| 1,011,445 | ||
Cash, end of period | $ | 4,162,548 | $ | 838,161 | ||
The Company has historically sought and continues to seek financing from private sources to implement its business plans. To satisfy its financial commitments, the Company has historically relied on private party financing, but that has inherent risks in terms of availability and adequacy of funding.
For the next twelve months, the Company anticipates that it will need to supplement its cash from revenues with additional cash raised from equity investment or debt transactions to ensure that the Company will have adequate cash to support its minimum operating cash requirements and thus to continue as a going concern.
There can be no guarantee or assurance that the Company can raise adequate capital from outside sources. If the Company is unable to raise funds when required or on acceptable terms, it may have to significantly reduce, or discontinue its operations.
Net cash used in operating activities
There was approximately $1,258,818 more cash used in operations in the nine months ended September 30, 2021, than in the twelve months ended 2020. Net loss increased ($10,523,323) year over year. Non-cash add backs increased $6,487,126 year over year and net change in operating assets and liabilities decreased ($135,704) over the comparable period.
Net cash used in investing activities
Cash used in investing activities is primarily due to the EON acquisition of $749,937.
61
Net cash flow from financing activities
There was net cash increase from financing activities of $4,779,400, for the nine months ended September 30, 2021, and twelve months 2020. In the nine months ended September 30, 2021, the Company raised $5,966,825 in new capital to support and build our operations. We issued convertible debt of $2,200,000, offset by convertible debt repayments of ($516,653).
In the nine months ended September 30, 2020, the Company issued $1,000,000 in preferred stock.
Future Capital Requirements
We have generated limited revenue, and as of September 30, 2021, our cash totaled $4,162,548 and we had an accumulated deficit of ($66,842,416). We anticipate that we will continue to incur net losses for the foreseeable future. However, changing circumstances may cause us to expend cash significantly faster than we currently anticipate, and we may need to spend more cash than currently expected because of circumstances beyond our control.
Historically, our principal sources of cash have included proceeds from the issuance of common and preferred equity and proceeds from the issuance of debt. Our principal uses of cash have included cash used in operations, payments for license rights and payments relating to purchases of property and equipment. We expect that the principal uses of cash in the future will be for continuing operations, and general working capital requirements. We expect that as our operations continue to grow, we will need to raise additional capital to sustain operations and growth.
The 2023 Notes
We have borrowed funds for business operations from two of our stockholders, Dreamcatcher, LLC and Running Wind, LLC, each of which is a beneficial holder of more than 5% of our common stock, through convertible debt agreements. Each Convertible Promissory Note was originally issued on December 5, 2018, on identical terms in the principal amount of $1,500,000, and each was amended and restated October 31, 2019, and October 23, 2020. The 2023 Notes carry interest at 10% per annum beginning on November 1, 2020, with monthly payments of unpaid interest accrued at 12.5% per annum to be paid in arrears through March 31, 2021, and mature on December 1, 2023. Beginning April 1, 2021, we began paying equal monthly installments of principal and interest on the 2023 Notes at 10% per annum. The 2023 Notes have aggregate remaining balances, including accrued interest, amounting to approximately $2.72 million and $3.23 million as of the nine months ended September 30, 2021, and the twelve months ended December 31, 2020, respectively. We incurred interest expense for the 2023 Notes in the amounts of approximately $0.247 million and $0.300 million for the nine months ended September 30, 2021, and the twelve months ended December 31, 2020, respectively. The 2023 Notes are convertible at any time prior to the maturity in whole or in part into shares of our common stock at a price of $0.60 per share. As of December 27, 2021, a total of $2,534,995 in principal and interest on the 2023 Notes was outstanding.
In November 2019, we also issued warrants to each of Dreamcatcher, LLC and Running Wind, LLC, to purchase 1,775,354 shares of our common stock, for an aggregate of 3,550,709 shares of our common stock, exercisable at $0.86 per share for a period of 10 years.
The 2022 Notes
From December 1, 2020 to June 1, 2021, we sold in a private placement, (i) $3,000,000 in aggregate principal amount of Senior Secured Promissory Notes and (ii) warrants to purchase 272,727 shares of our common stock at an exercise price of $2.75 per share. The investors in this offering included entities controlled by Mr. Cassidy, who is a member of our board of directors. In connection with the offering, the entities controlled by Mr. Cassidy purchased an aggregate of $2,350,000 principal amount of the 2022 Notes and warrants to purchase an aggregate of 213,637 shares of our common stock at $2.75 per share. The warrants have a term of 10 years. The 2022 Notes mature on December 1, 2022. The 2022 Notes accrue interest in two different ways: (A) at the rate of 4% per annum, payable in cash, from the date of issuance of each note as follows: (1) interest from the issue date to November 30, 2021 is payable in advance on the date the note was executed; (2) six months of cash interest is payable in arrears on June 1, 2022; and (3) six months of cash
62
interest is payable in arrears on the maturity date; and (B) at the rate of 6% per annum, payable in shares of our common stock in arrears on June 1, 2021, December 1, 2021, June 1, 2022, and the maturity date. As of December 27, 2021, a total of $3,105,884 in principal and interest was outstanding on the 2022 Notes.
The 2020 and 2021 Share Offering
In 2020 and 2021, we offered and sold in a private placement to accredited investors, $6,705,000 of shares of common stock at a price of $1.25 per share. The investors in this offering included an entity controlled by Mr. Cassidy, who is a member of our board of directors, which invested $1.2 million for a total of 960,000 shares of common stock.
The 2021 Share and Warrant Offering
On September 30, 2021, we entered into securities purchase agreements with accredited investors pursuant to which we sold, in a private offering (i) an aggregate of 5,773,460 shares of our common stock and (ii) warrants to purchase up to an aggregate of 6,573,460 shares of common stock. Each investor was entitled to purchase one share of common stock and one warrant to purchase one share of common stock for an aggregate purchase price of $1.25. The warrants were immediately exercisable, have a three-year term and an exercise price of $2.75 per share. The investors in the offering included an entity controlled by Mr. Cassidy, who is a member of our board of directors. The entity controlled by Mr. Cassidy purchased 320,000 shares of common stock and warrants to purchase 320,000 shares of common stock in the offering, for gross proceeds of $400,000. Other investors in this offering were entities controlled by Jeremy Boczulak, who, as a result of these investments, became a beneficial holder of more than 5% of our common stock. Pursuant to the terms of this offering, an investor who purchased more than 50% of the total offering amount was entitled to receive warrants to purchase to purchase an additional 800,000 shares of common stock. That investor was an entity controlled by Mr. Boczulak. In total, the entities controlled by Mr. Boczulak purchased 5,453,460 shares of common stock and warrants to purchase 6,253,460 shares of common stock in the offering, for gross proceeds of $6,816,825.
Our future use of operating cash and capital requirements will depend on many forward-looking factors, including the following:
| ● | Our ability to attract and retain management with experience in digital media including digital video music streaming, and similar emerging technologies; |
| ● | Our ability to negotiate, finalize and maintain economically feasible agreements with the major and independent music labels, publishers and performance rights organizations; |
| ● | Our expectations regarding market acceptance of our products in general, and our ability to penetrate the digital video music streaming market in particular; |
| ● | The scope, validity and enforceability of our and third-party intellectual property rights; |
| ● | Our ability to comply with governmental regulation; |
| ● | The intensity of competition; |
| ● | The effects of the ongoing pandemic caused by the spread of COVID-19 and our business customers ability to service their customers in out of home venues, especially considering government-imposed business shutdowns and capacity limitations; |
| ● | Changes in the political and regulatory environment and in business and fiscal conditions in the United States and overseas; |
| ● | Our ability to attract prospective users and to retain existing users; |
63
| ● | Our dependence upon third-party licenses for sound recordings and musical compositions; |
| ● | Our lack of control over the providers of our content and their effect on our access to music and other content; |
| ● | Our ability to comply with the many complex license agreements to which we are a party; |
| ● | Our ability to accurately estimate the amounts payable under our license agreements; |
| ● | The limitations on our operating flexibility due to the minimum guarantees required under certain of our license agreements; |
| ● | Our ability to obtain accurate and comprehensive information about music compositions in order to obtain necessary licenses or perform obligations under our existing license agreements; |
| ● | Potential breaches of our security systems; |
| ● | Assertions by third parties of infringement or other violations by us of their intellectual property rights; |
| ● | Competition for users and user listening time; |
| ● | Our ability to generate sufficient revenue to be profitable or to generate positive cash flow on a sustained basis; |
| ● | Our ability to accurately estimate our user metrics; |
| ● | Risks associated with manipulation of stream counts and user accounts and unauthorized access to our services; |
| ● | Changes in legislation or governmental regulations affecting us; |
| ● | Ability to hire and retain key personnel; |
| ● | Our ability to maintain, protect and enhance our brand; |
| ● | Risks associated with our international expansion, including difficulties obtaining rights to stream music on favorable terms; |
| ● | Risks relating to the acquisition, investment and disposition of companies or technologies; |
| ● | Dilution resulting from additional share issuances; |
| ● | Tax-related risks; |
| ● | The concentration of voting power among our founders who have and will continue to have substantial control over our business; |
| ● | International, national, or local economic, social or political conditions, and |
| ● | Risks associated with accounting estimates, currency fluctuations and foreign exchange controls. |
We have evaluated and expect to continue to evaluate a wide array of strategic transactions as part of our plan to acquire or license and develop additional products and services to augment our current business operations. Strategic
64
transaction opportunities that we may pursue could materially affect our liquidity and capital resources and may require us to incur additional indebtedness, seek equity capital or both. Accordingly, we expect to continue to opportunistically seek access to additional capital to license or acquire additional products, services or companies to expand our operations, or for general corporate purposes. Strategic transactions may require us to raise additional capital through one or more public or private debt or equity financings or could be structured as a collaboration or partnering arrangement. We have no arrangements, agreements, or understandings in place at the present time to enter into any acquisition, licensing or similar strategic business transaction.
If we raise additional funds by issuing equity securities, our stockholder will experience dilution. Debt financing, if available, would result in increased fixed payment obligations and may involve agreements that include covenants limiting or restricting our ability to take specific actions, such as incurring additional debt, making capital expenditures, or declaring dividends. Any debt financing or additional equity that we raise may contain terms, such as liquidation and other preferences that are not favorable to us or our stockholder.
PPP Loan Round 1
On May 10, 2021, we received a notification from the U.S. Small Business Association (the “SBA”) for the full forgiveness of the Paycheck Protection Program of the CARES Act (“PPP”) loan of $573,500 received on April 27, 2020. The first round of the PPP loans forgiven consisted of $573,500 of principal and $5,986 of accrued interest.
PPP Loan Round 2
On April 26, 2021, we received the proceeds from a PPP loan in the amount of $486,638. The loan matures on April 19, 2026 and bears interest at a rate of 1% per annum. The loan is evidenced by a promissory note, dated as of April 19, 2021, which contains customary events of default relating to, among other things, payment defaults and breaches of representations and warranties. All or a portion of the loan may be forgiven by the SBA upon our application beginning eight weeks (but not later than 24 weeks (“covered period”)) after loan approval and upon documentation of expenditures in accordance with the SBA’s requirements. We may prepay this PPP loan at any time prior to maturity with no prepayment penalties. Repayment begins ten months after the covered period, with payments beginning on July 31, 2022.
In the event the loan, or any portion thereof, is forgiven pursuant to the PPP, the amount forgiven is applied to outstanding principal. While we intend to apply for the forgiveness of the PPP loan, there is no assurance that we will obtain forgiveness of this PPP loan in whole or in part. We intend to use the proceeds from the loan for qualifying expenses.
Going Concern
As of September 30, 2021, the Company had cash of $4,162,548 and an accumulated deficit of $ (66,842,416). During the nine months ended September 30, 2021, the Company used net cash in operating activities of $ (7,162,546). The Company has incurred net losses since inception. These conditions raise substantial doubt about the Company’s ability to continue as a going concern within one year from the issuance date of these consolidated financial statements.
The Company’s primary source of operating funds since inception has been cash proceeds from debt and equity financing transactions. The ability of the Company to continue as a going concern is dependent upon its ability to generate sufficient revenue and its ability to raise additional funds by way of its debt and equity financing efforts. There can be no assurance that adequate financing will be available in a timely manner, on acceptable terms, or at all.
The accompanying consolidated financial statements have been prepared on a going concern basis, which contemplates the realization of assets and the satisfaction of liabilities in the normal course of business. These consolidated financial statements do not include any adjustments relating to the recovery of the recorded assets or classification of the liabilities that might be necessary should the Company be unable to continue as a going concern. The ability of the Company to continue as a going concern is dependent on management’s further implementation of the Company’s on-going and strategic plans, which include continuing to raise funds through equity and/or debt raises. Should the Company be unable to raise adequate funds, certain aspects of the on-going and strategic plans may require modification.
65
Recent Accounting Pronouncements
See our discussion in “Note 2 – Summary of Significant Accounting Policies” in our Consolidated Financial Statements included in Item 15 of this Transition Report.
ITEM 7A. QUANTITATIVE AND QUALITATIVE DISCLOSURES ABOUT MARKET RISK.
We are a smaller reporting company as defined by Rule 12b-2 of the Exchange Act and are not required to provide the information under this item.
ITEM 8. FINANCIAL STATEMENTS AND SUPPLEMENTARY DATA.
The financial statements and supplementary data required by this Item 8 are listed in Item 15 – “Exhibits and Financial Statement Schedules” of this Transition Report.
ITEM 9. CHANGES IN AND DISAGREEMENTS WITH ACCOUNTANTS ON ACCOUNTING AND FINANCIALS DISCLOSURES.
None.
ITEM 9A. CONTROLS AND PROCEDURES.
Evaluation of Disclosure Controls and Procedures
Our management evaluated the effectiveness of our disclosure controls and procedures as defined in Rule 13a-15(c) and 15d-15(e) under the Exchange Act, as of September 30, 2021. Our disclosure controls and procedures are designed to provide reasonable assurance that information we are required to disclose in the reports we file or submit under the Exchange Act is accumulated and communicated to our management, including our CEO and CFO, as appropriate to allow timely decisions regarding required disclosures, and is recorded, processed, summarized, and reported within the time periods specified in the SEC’s rules and forms.
Based on this evaluation, and because of the material weaknesses described below, our CEO and CFO have concluded that our disclosure controls and procedures were not effective at the reasonable assurance level as of September 30, 2021.
Management’s Annual Report on Internal Control Over Financial Reporting
Our management is responsible for establishing and maintaining adequate internal control over financial reporting as defined in Rules 13a-15(f) and 15d-15(f) under the Exchange Act. Internal control over financial reporting is a process designed to provide reasonable assurance of the reliability of financial reporting and of the preparation of financial statements for external reporting purposes, in accordance with U.S. generally accepted accounting principles.
Internal control over financial reporting includes policies and procedures that (1) pertain to the maintenance of records that, in reasonable detail, accurately and fairly reflect transactions and disposition of assets; (2) provide reasonable assurance that transactions are recorded as necessary to permit preparation of financial statements in accordance with U.S. generally accepted accounting principles, and that receipts and expenditures are being made only in accordance with the authorization of its management and directors; and (3) provide reasonable assurance regarding the prevention or timely detection of unauthorized acquisition, use or disposition of our assets that could have a material effect on tis financial statements.
Under the supervision and with the participation of our management, including our CEO and CFO, we conducted an evaluation of the effectiveness of our internal control over financial reporting based on criteria established in the framework in Internal Control - Integrated Framework (2013) issued by the Committee of Sponsoring Organizations of
66
the Treadway Commission. Based on this evaluation, and because of the material weaknesses described below, our management concluded that our internal control over financial reporting was not effective as of September 30, 2021.
Because of its inherent limitations, internal control over financial reporting may not prevent or detect misstatements. Also, projections of any evaluation of effectiveness to future periods are subject to the risks that controls may become inadequate because of changes in conditions, or that the degree of compliance with the policies or procedures may deteriorate.
This Annual Report does not include an attestation report of our independent registered public accounting firm because we are a “non-accelerated filer,” and may take advantage of certain exemptions from various reporting requirements that are applicable to public companies that are accelerated filers, including, but not limited to, not being required to comply with the auditor attestation requirements of Section 404(b) of the Sarbanes-Oxley Act.
Material weaknesses and management’s remediation plan
A material weakness is a deficiency, or a combination of deficiencies, within the meaning of Public Company Accounting Oversight Board (“PCAOB”) Auditing Standard AS 2201, in internal control over financial reporting, such that there is a reasonable possibility that a material misstatement of the Company’s annual or interim financial statements will not be prevented or detected on a timely basis.
Internal control over financial reporting is a process designed to provide reasonable assurance regarding the reliability of financial reporting and the preparation of financial statements in accordance with U.S. GAAP. The following material weaknesses in our internal control over financial reporting were identified in the normal course as of September 30, 2021:
The Company failed to maintain an effective control environment due to the following:
| ● | the Company’s management and the governance had insufficient oversight of the design and operating effectiveness of the Company’s disclosure controls and internal controls over financial reporting; |
| ● | the Company failed to maintain effective controls over the period-end financial reporting process, including controls with respect to preparation and disclosure of provision for income taxes, valuation and presentation of asset acquisition, content assets and liabilities, and investments; and |
| ● | the Company failed to maintain effective controls over journal entries, both recurring and nonrecurring, and account reconciliations and did not maintain proper segregation of duties. Journal entries were not always accompanied by sufficient supporting documentation and were not adequately reviewed and approved for validity, completeness and accuracy. In most instances, persons responsible for reviewing journal entries and account reconciliations for validity, completeness and accuracy were also responsible for preparation. |
Management’s Remediation Initiatives
We have concluded that these material weaknesses arose because, as previously a private company, we did not have the necessary business processes, systems, personnel, and related internal controls. We began to undertake measures to address material weaknesses in our internal controls. We will continue to take steps to remediate these material weaknesses.
We will strive to ensure that a proper, consistent tone is communicated throughout the organization, which emphasizes the expectation that previously existing deficiencies will be rectified through implementation of processes and controls to ensure strict compliance with accounting principles generally accepted in the United States and regulatory requirements.
67
We have retained a third–party consulting firm that specializes in internal audit work, and more specifically internal controls work. This firm will assist management with its risk assessment of internal control over financial reporting as well as documentation and testing of our internal control structure and evaluation of material weaknesses.
With oversight from the Audit Committee, management will design and implement remediation measures to address the material weaknesses described above and enhance our internal control over financial reporting.
There was a change in our internal control over financial reporting (as such term is defined in Exchange Act Rule 13a-15(f)) that occurred during our most recent quarter that has materially affected or is reasonably likely to materially affect, our internal control over financial reporting.
Changes in Internal Controls over Financial Reporting
Other than described above, there have not been any changes in our internal control over financial reporting (as such term is defined in Exchange Act Rule 13a.
ITEM 9B. OTHER INFORMATION.
None.
68
PART III
ITEM 10. DIRECTORS, EXECUTIVE OFFICERS AND CORPORATE GOVERNANCE.
The following table sets forth the names, ages, and positions of our executive officers and directors as of December 27, 2021:
Name |
| Age |
| Position |
Jon M. Niermann | 56 | Chief Executive Officer, Chairman & Director | ||
Neil Watanabe | 67 | Chief Financial Officer | ||
Liam McCallum | 40 | Chief Product and Technical Officer | ||
Andy Schuon | 57 | Head of Loop Media Studios | ||
Bob Gruters | 53 | Chief Revenue Officer | ||
Bruce A. Cassidy | 71 | Director | ||
Denise M. Penz | 53 | Director | ||
Sonya Zilka | 52 | Director |
The business address of each of Mr. Cassidy, Ms. Penz, Ms. Zilka, Mr. Niermann, Mr. Watanabe, Mr. McCallum, Mr. Schuon and Mr. Gruters is 700 N. Central Avenue, Suite 430, Glendale, California 91203. The following is a brief biography of each of our executive officers and directors:
Executive Officers
Jon M. Niermann is our Co-Founder and has been Chairman and Chief Executive Officer since May 2016. Mr. Niermann is responsible for guiding the vision and strategy of the Company and leading the management team. Prior to founding Loop Media in 2016, Mr. Niermann founded FarWest Entertainment, a global platform bridging the Asia-Pacific region and the West through multimedia entertainment and strategic partnerships, and served as its Chief Executive Officer and Executive Producer from 2010 to 2015. From 2008 to 2011, Mr. Niermann was a Late Night Talk Show Host for the Fox International Channel’s “Asia Uncut.” He served as President of Electronic Arts Asia from 2003 to 2010, where he helped move the company’s game portfolio into online gaming, and spent fifteen years, from 1988-2003, with The Walt Disney Company, including as Managing Director and President, Asia Pacific, of Walt Disney International from 2001 to 2003. Mr. Niermann holds a Bachelor of Science and Arts in Finance and Marketing from the University of Denver, and an MBA from UCLA’s Anderson School of Management. Mr. Niermann was chosen to serve as a member of our Board of Directors due to his extensive experience in the entertainment industry, as well as the perspective he brings as our Co-Founder and CEO.
Neil Watanabe has served as our Chief Financial Officer since September 2021. He is responsible for overseeing the Company’s financial affairs. Prior to joining the Company, Mr. Watanabe was most recently Principal of Watanabe Associates where he provided senior financial and accounting leadership to various companies, including Value Village Inc. (d.b.a “Savers”) and High Times Holding Corp. From 2015 to 2019, Mr. Watanabe was Chief Financial Officer of CarParts.com, Inc., (NASDAQ: PRTS), a publicly traded American online retailer of automotive parts and accessories for cars, vans, trucks, and sport utility vehicles, which reported over $440 million in net sales in its fiscal year ended January 2021. Mr. Watanabe also served as EVP & Chief Financial Officer of PetSmart Inc.’s (NASDAQ: PETM). Mr. Watanabe also worked in various financial and operational leadership roles at National Stores, Inc., Anna’s Linens, Shoe Pavilion (previously listed on Nasdaq while Mr. Watanabe was employed), and Mac Frugal’ s Bargains – Closeouts Inc. (d.b.a. “Pic N’ Sav”), (previously listed on NYSE while Mr. Watanabe was employed). Mr. Watanabe is currently a board member of the National Corvette Museum and Reality Venture International and received his CPA certification in the State of Illinois. Mr. Watanabe holds a Bachelor of Arts from University of California, Los Angeles and a CPA Certification from University of Illinois at Urbana-Champaign.
Liam McCallum is our Co-Founder and has been Chief Product and Technical Officer since May 2016. He oversees our product strategy, design, and development across mobile, TV and out-of-home, along with our technical operations. Mr. McCallum founded Encoder Farm, a video encoding Software-as-a-Service platform for developers, in 2017, and served as its Chief Executive Officer from 2017 to 2020. He served as an advisor to Motorola Outdoor from
69
2015 to 2016; he was the Founder and Chief Technology Officer of cloud media company Hive Cloud Ltd from 2014 to 2015 and was a Senior Advisor to FarWest Entertainment from 2010 to 2015. Prior to 2015, Mr. McCallum was the Founder and Chief Executive Officer of QVIVO, a global enterprise cloud media platform backed by SingTel Innov8 from 2010 to 2014, and from 2000 to 2010, was at Electronic Arts, eventually becoming Asia Pacific’s Head of Online Technology.
Andy Schuon has served as the Head of Loop Media Studios since November 2020. He is responsible for all video and audio content, programming creation and acquisitions at Loop for both the B2B and consumer platforms. Prior to joining Loop in 2020, in 2018, Mr. Schuon co-founded Spkr (acquired by Loop in 2020) and served as its Chief Executive Officer, where he conceived and launched a platform to solve discovery and time-related issues with podcasting. Before forming Spkr, in 2011, Mr. Schuon co-founded and was the Founding President of Revolt Media & TV, a music-focused television network. From 2011 to 2015, Mr. Schuon was Chief Digital Officer and President, Artist Services for LiveNation. He founded the International Music Feed Network for Universal Music Group in 2007 and served as its President and Chief Executive Officer. From 2002 to 2004, Mr. Schuon was President of Programming and Marketing for CBS Radio. Prior to that, in 2001, he founded and served as the Chief Executive Officer of the Sony Music Group/Universal joint venture PressPlay, the first music subscription service which was subsequently acquired and renamed Napster. Mr. Schuon was Executive Vice President and General Manager for Warner Bros Records from 1988 to 2000, and from 1992 to 1998, the Executive Vice President of Programming and Production for MTV, the music television cable channel, in the early days of its success. He is currently a member of the boards of directors for Teach for America and CoFoundersLab.
Bob Gruters has served as our Chief Revenue Officer since May 2021. As our Chief Revenue Officer, he is responsible for the monetization of proprietary Loop assets across digital out-of-home, connected television and mobile app activities. Additionally, Mr. Gruters is also responsible for the growth and expansion of our overall revenue and Loop player network. In addition to his role as Chief Revenue Officer at Loop Media, Mr. Gruters also concurrently serves as a strategic advisor for MetaVRSE, a universal interactive web-based platform. Prior to this, from 2018 to 2021, Mr. Gruters was the Chief Revenue Officer of the Digital Trends Media Group, leading all on-platform and off-platform revenue creation initiatives with a high-performing sales and marketing team. Mr. Gruters also held P&L oversight and directed sales function, corporate development, marketing, pricing, and revenue management. From 2014 to 2018, Mr. Gruters served as Facebook's Group Head of Sales Emerging Entertainment & Technology where he led the rapid growth and sustainable development of multiple vertical industries. Mr. Gruters served as EVP Sales & Marketing of REVOLT MEDIA & TV from 2013 to 2014, and spent four years, from 2009-2013, as SVP of Client Development at Univision Communications. From 2005 to 2009, Mr. Gruters served as Vice President of Business Development for MTV Networks' Entertainment Group, which included Comedy Central, CMT, Spike TV, and TV Land. From 2002 to 2005, Mr. Gruters was the Director of Marketing Services for The New Yorker and spent three years as a Media Director of Sony Electronics from 1999 to 2002. Prior to 2002, Mr. Gruters led sales & marketing for JC Decaux's airport advertising division in the US. Mr. Gruters holds a Bachelor of Arts in Communications, Advertising from Rowan University.
Non-Employee Directors
Bruce A. Cassidy is a member of our Board of Directors. He has been a member of our Board of Directors since early 2020. In addition to his role on our Board of Directors, Mr. Cassidy currently serves on the boards for various companies, including as Chairman of the Board of each of Ultimate Gamer, Assisted 4 Living, Inc., and Segmint. He serves as Chairman of the Sarasota Green Group, the Executive Chairman of each of CelebYou LLC and CelebYou Productions, and is on the board of directors of Selinsky Force LLC. He was also the founding investor and served on the board of directors of Ohio Legacy Corp. Previously, Mr. Cassidy was the founder and CEO of Excel Mining Systems from 1991 until its sale in 2007 to Orica Mining Services, and from 2008 to 2009, served as the President and CEO of one of its subsidiaries, Minora North & South Americas. He is currently the President of The Concession Golf Club in Sarasota, Florida. Mr. Cassidy was chosen to serve as a member of our Board of Directors due to his extensive leadership and business experience in the entertainment and media industry and as a CEO of a large company, as well as his service on other boards of directors.
Denise M. Penz is a member of our Board of Directors. She has been a member of our Board of Directors since October 2021. In addition to her role on our Board of Directors, Ms. Penz concurrently serves as the President and Chief
70
Executive Officer of The Preferred Legacy Trust Company, a state-chartered trust company which Ms. Penz also founded. Ms. Penz served as Founder, Executive Vice President, Chief Operating Officer and Wealth Manager of Premier Bank & Trust / Ohio Legacy Corp for nine years from 2010 to 2019. In this role, Ms. Penz was responsible for four major sales divisions in retail banking, mortgage banking, private banking, and wealth services (including trust and investments). From 2008 to 2010, Ms. Penz founded Excel Financial / Excel Bancorp and led a group of private equity investors to create a community bank and trust company. Lastly, Ms. Penz was the Senior Vice President & Trust and Investment Services Director of the Belmont National Bank / Sky Bank / Huntington Bank from 1996 to 2008, where she managed the trust and investment departments, developed strategic planning initiatives and was directly responsible to the CEO and Board of Directors. Ms. Penz holds a Bachelor’s of Science in Management and Accounting from West Liberty State College, and an MBA from Wheeling Jesuit University. Ms. Penz was chosen to serve as a member of our Board of Directors due to her considerable leadership experience in the financial sector along with proven success in raising capital, strategic planning and organizational growth.
Sonya Zilka is a member of our Board of Directors. She has been a member of our Board of Directors since October 2021. In addition to her role on our Board of Directors, Ms. Zilka currently serves as the President & Chair of The Beyond Benefits Life Sciences Board of Trustees, a position she has held since 2020. Furthermore, since 2019, Ms. Zilka has served as the Senior Vice President of Human Resources at Chan Zuckerberg Biohub where she leads HR functions and spearheads internal communications. From 2013 through 2015, and again in 2018, Ms. Zilka was an Executive Coach and Organizational Development/Human Resource consultant at ZHR Consulting, a firm specializing in independent organizational development and human capital consulting. From 2013 to 2015, and again in 2018, Ms. Zilka served as Vice President of Human Resources at Actelion Pharmaceuticals, where she led human resources, corporate communications and facilities for the United States. Ms. Zilka holds a Bachelor of Science in Psychology from Washington State University, and a Master’s Degree in Organizational Psychology from Columbia University. Ms. Zilka was chosen to serve as a member of our Board of Directors for her proven leadership and extensive experience in human capital consulting and human resources.
Family Relationships
There are no family relationships among our directors or executive officers.
Section 16(a) Beneficial Ownership Reporting Compliance
Section 16(a) of the Securities Exchange Act of 1934, as amended, requires the Company’s directors and executive, officers, and persons who are beneficial owners of more than 10% of a registered class of the Company’s equity securities, to file reports of ownership and changes in ownership with the SEC. These persons are required by SEC regulations to furnish the Company with copies of all Section 16(a) forms they file.
Based solely upon the Company’s review of copies of Forms 3, 4 and 5 furnished to the Company, the Company believes that all of its directors, executive officers and any other applicable stockholders timely filed all reports required by Section 16(a) of the Exchange Act during the fiscal year ended September 30, 2021, except for the following: (i) the Company filed a Form 3 and a Form 4 for Jon Niermann on October 15, 2021, which were due on February 17, 2020 and November 12, 2020, respectively; (ii) the Company filed a Form 3 for Pioneer Productions LLC (affiliated with Jon Niermann) on October 15, 2021, which was due on February 17, 2020; (iii) the Company filed a Form 3 for Liam McCallum on October 15, 2021, which was due on April 12, 2021; (iv) the Company filed a Form 3 and a Form 4 for James Cerna on October 15, 2021, which were due on February 17, 2020 and June 17, 2020, respectively; (v) the Company filed a Form 4 for the Bruce A. Cassidy 2013 Irrevocable Trust on October 15, 2021 covering transactions that each required Form 4 filings due on February 7, 2020, October 2, 2020, December 3, 2020 and June 3, 2021, respectively; (vi) the Company filed a Form 4 for Bruce A. Cassidy on October 15, 2021 covering transactions that each required Form 4 filings due on February 7, 2020, March 13, 2020, October 2, 2020, December 3, 2020 April 5, 2021, May 4, 2021, June 3, 2021, August 19, 2021 and October 4, 2021, respectively; and (vii) Dreamcatcher, LLC and Running Wind, LLC, each of which are owners of ten percent or more of our common stock, have not filed their required Forms 3, 4 and 5.
71
Code of Business Conduct and Ethics
The Company has adopted a Code of Business Conduct and Ethics that applies to its directors, officers and employees. The purpose of the Code of Business Conduct and Ethics is to deter wrongdoing and to provide guidance to the Company’s directors, officers and employees to help them recognize and deal with ethical issues, to provide mechanisms to report unethical or illegal conduct and to contribute positively to the Company’s culture of honesty and accountability. The Company’s Code of Business Conduct and Ethics is publicly available on the Company’s website at https://www.loop.tv. If the Company makes any substantive amendments to the Code of Business Conduct and Ethics or grants any waiver, including any implicit waiver from a provision of the Code of Business Conduct and Ethics to its directors or executive officers, the Company will disclose the nature of such amendments or waiver on its website or in a current report on Form 8-K.
Board Leadership Structure and Role in Risk Oversight
The Chief Executive Officer and Chairman of the Board positions are both held by Mr. Niermann. Periodically, our Board of Directors assesses these roles and the Board of Directors leadership structure to ensure the interests of our Company and our stockholders are best served. Our Board of Directors has determined that its current leadership structure is appropriate. Mr. Niermann, as one of our founders and as our chief executive officer and Chairman, has extensive knowledge of all aspects of Loop, our business and risks.
While management is responsible for assessing and managing risks to Loop, our Board of Directors is responsible for overseeing management’s efforts to assess and manage risk. This oversight is conducted primarily by our full Board of Directors, which has responsibility for general oversight of risks, and standing committees of our Board of Directors. Our Board of Directors satisfies this responsibility through full reports by each committee chair regarding the committee’s considerations and actions, as well as through regular reports directly from officers responsible for oversight of particular risks within our Company. Our Board of Directors believes that full and open communication between management and the Board of Directors is essential for effective risk management and oversight.
Committees of the Board of Directors
Our Board of Directors has established an Audit Committee, a Compensation Committee, and a Nominating and Corporate Governance Committee. Our Board of Directors may establish other committees to facilitate the management of our business. The composition and functions of each committee are described below. Members serve on these committees until their resignation or until otherwise determined by our Board of Directors. Each of these committees operates under a charter that has been approved by our Board of Directors, which is available on our website.
Audit Committee. Our Audit Committee consists of Denise Penz, Sonya Zilka, and Bruce Cassidy, with Denise Penz serving as the Chair of the Audit Committee. Our Board of Directors has determined that the directors that serve on our Audit Committee are independent within the meaning of the Nasdaq Listing rules and Rule 10A-3 under the Exchange Act. In addition, our Board of Directors has determined that Denise Penz qualifies as an “audit committee financial expert” within the meaning of SEC regulations and the Nasdaq rules.
The Audit Committee oversees and monitors our financial reporting process and internal control system, reviews and evaluates the audit performed by our registered independent public accountants and reports to the board of directors any substantive issues found during the audit. The Audit Committee is directly responsible for the appointment, compensation and oversight of the work of our registered independent public accountants. The Audit Committee reviews and approves all transactions with affiliated parties.
Compensation Committee. Our Compensation Committee consists of Denise Penz and Sonya Zilka, with Sonya Zilka serving as the Chairman of the Compensation Committee. Our Board of Directors has determined that the directors that serve on our Compensation Committee are independent under the listing standards, are “non-employee directors” as defined in rule 16b-3 promulgated under the Exchange Act and are “outside directors” as that term is defined in Section 162(m) of the Internal Revenue Code of 1986, as amended.
72
The Compensation Committee provides advice and makes recommendations to the Board of Directors in the areas of employee salaries, benefit programs and director compensation. The Compensation Committee also reviews and approves corporate goals and objectives relevant to the compensation of our President, Chief Executive Officer, and other officers and makes recommendations in that regard to the Board of Directors as a whole.
Nominating and Corporate Governance Committee. Our Nominating and Corporate Governance Committee consists of Denise Penz and Bruce Cassidy, with Bruce Cassidy serving as the Chairman of the Nominating and Corporate Governance Committee. The Nominating and Corporate Governance Committee nominates individuals to be elected to the Board of Directors by our stockholders. The Nominating and Corporate Governance Committee considers recommendations from stockholders if submitted in a timely manner in accordance with the procedures set forth in our Amended and Restated Bylaws (the “Bylaws”) and will apply the same criteria to all persons being considered. All members of the Nominating and Corporate Governance Committee are independent directors as defined under the Nasdaq rules.
Board Composition
Our Board currently consists of four members. Our directors hold office until their successors have been elected and qualified or until the earlier of their resignation or removal.
We have no formal policy regarding board diversity. Our priority in selection of board members is identification of members who will further the interests of our stockholders through his or her established record of professional accomplishment, the ability to contribute positively to the collaborative culture among board members, knowledge of our business and understanding of the competitive landscape.
ITEM 11. EXECUTIVE COMPENSATION.
Executive and Director Compensation
All decisions regarding compensation for our executive officers and executive compensation programs are reviewed, discussed and approved by the Compensation Committee. Prior to the establishment of the Compensation Committee in December 2021, this this was done by the full Board. All compensation decisions are determined following a detailed review and assessment of the executive’s leadership and operational performance and contributions to our success; any significant changes in role or responsibility; our financial resources, results of operations and financial projections; the nature, scope and level of the executive’s responsibilities; and internal equity of pay relationships.
The Compensation Committee determines each element of compensation for our CEO. When making determinations about each element of compensation for our other executive officers, the Compensation Committee also considers recommendations from our CEO. Additionally, at the Compensation Committee’s request, our executive officers may assess the design of, and make recommendations related to, our compensation and benefit programs, including recommendations related to the performance measures used in our incentive programs. The Compensation Committee is under no obligation to implement these recommendations.
We have not, to date, engaged any outside compensation consultants to provide advice on compensation matters.
73
The following table summarizes information concerning the compensation awarded to, earned by, or paid to, our Chief Executive Officer (“Principal Executive Officer”) and our two most highly compensated executive officers other than the Principal Executive Officer (collectively, the “Named Executive Officers”) during the nine months ended September 30, 2021, and each of the twelve-month periods ended December 31, 2020, and 2019.
Name & Principal Position | Period Ended (1) | Salary ($) | Bonus ($) | Option Awards ($) (2) | Total ($) |
Jon M. Niermann Chief Executive Officer, Chairman & Director | September 30, 2021 December 31, 2020 December 31, 2019 | 320,447 (3) 271,395 179,310 | - 84,043 - | 2,625,000 0 | 2,945,447 355,438 179,310 |
Liam McCallum Chief Product and Technical Officer | September 30, 2021 December 31, 2020 December 31, 2019 | 186,875 116,288 43,754 | - - - | 1,050,000 0 0 | 1,236,875 116,288 43,754 |
Andy Schuon (4) Head of Loop Media Studios | September 30, 2021 December 31, 2020 December 31, 2019 | 207,000 54,050 - | - 28,660 - | 6,621,333 - - | 6,828,333 82,710 - |
| (1) | In September 2021, we changed our fiscal year end from December 31 to September 30. The 2021 salary amounts reflect the compensation earned from January 1, 2021 to September 30, 2021. |
| (2) | The fair value of stock options is estimated as of the date of grant using the Black-Scholes-Merton option-pricing model. We use the simplified method to estimate the expected term of options due to insufficient history and high turnover in the past. Further information regarding assumptions made in calculating the grant date fair value of options can be found in “Note 16 – Stock Options and Warrants” to our Consolidated Financial Statements. |
| (3) | Includes $67,280 in unpaid and accrued salary and expenses from previous periods in which Mr. Niermann was not paid for his service. |
| (4) | Mr. Schuon became Head of Loop Media Studios on October 12, 2020. |
As of the nine months ended September 30, 2021, we had no plans in place and had never maintained any plans that provided for the payment of retirement benefits or benefits that will be paid primarily following retirement including, but not limited to, tax qualified deferred benefit plans, supplemental executive retirement plans, tax-qualified deferred contribution plans and nonqualified deferred contribution plans.
Employment Agreements
Jon Niermann – Employment Agreement
We entered into an employment agreement with Jon Niermann, the Chief Executive Officer (the “CEO Employment Agreement”), effective as of March 1, 2021. Pursuant to the CEO Employment Agreement, the term of employment is three (3) years, renewable every three (3) years, unless terminated. Mr. Niermann is entitled to receive an annual base salary of $350,000 as well as discretionary bonuses as may be awarded from time to time by the Compensation Committee of the Board, if one exists, or by our Board, and he is entitled to an up-list bonus of $350,000 upon the listing of our common stock on a national securities exchange. Mr. Niermann is eligible to participate in all benefit plans that we offer to our executive officers, including any incentive compensation plans.
The CEO Employment Agreement terminates upon death or disability and may be terminated by us with or without cause, and by Mr. Niermann with or without good reason (all as defined in the CEO Employment Agreement). If the CEO Employment Agreement is terminated upon the death or disability of Mr. Niermann, he will receive unpaid and
74
accrued base salary through date of termination, unpaid and accrued bonus, and payment of pro rata portion of yearly bonus (if any). In addition, upon termination for disability, Mr. Niermann will receive twelve (12) months’ severance.
If we terminate Mr. Niermann for cause or Mr. Niermann resigns without good reason, Mr. Niermann will receive only unpaid and accrued base salary through the date of termination and any unpaid and accrued bonus. Should Mr. Niermann be terminated without cause or resign with good reason, Mr. Niermann is entitled to receive unpaid and accrued base salary and unpaid and accrued bonus through the date of termination, payment of the pro rata portion of yearly bonus of at least one year’s base salary, a lump sum payment of twenty-four (24) months’ salary, payment of his base salary for the remaining term of the CEO Employment Agreement or a period of twelve (12) months, whichever is longer, and full vesting of all stock grants.
If at any time during the term of the CEO Employment Agreement Mr. Niermann’s employment is terminated after a “Change in Control” (as defined in the CEO Employment Agreement), compensation is similar to that in a termination without cause or resignation for good reason. In addition, Mr. Niermann will be entitled to receive a lump sum payment equal to the sum of (i) ten (10) times his base salary, bonuses, and the value of certain annual fringe benefits specified in the CEO Employment Agreement for the year in which Mr. Niermann’s term of employment terminates, and (ii) the value of the portion of his benefits under any savings, pension, profit sharing or deferred compensation plans that are forfeited under those plans by reason of the termination of his employment.
Mr. Niermann’s right to receive any severance benefit under the CEO Employment Agreement is subject to the execution and delivery to us of a general release of claims in substantially the form attached to the CEO Employment Agreement.
The CEO Employment Agreement contains customary non-compete, non-solicitation, and other restrictive covenants to which Mr. Niermann is subject during the term of his employment and for a 12-month period following termination for cause or resignation without good reason.
Liam McCallum – Employment Agreement
We entered into an employment agreement with Liam McCallum, the Chief Product and Technical Officer (the “CPTO Employment Agreement”), which is effective as of April 1, 2021. Pursuant to the CPTO Employment Agreement, the term of employment is three (3) years, renewable every three (3) years, unless terminated. Mr. McCallum is entitled to receive an annual base salary of $275,000 as well as discretionary bonuses as may be awarded from time to time by the Compensation Committee of the Board, if one exists, or by our Board, and he is entitled to an up-list bonus of $250,000 upon the listing of our common stock on a national securities exchange. Mr. McCallum is eligible to participate in all benefit plans that we offer to our executive officers, including any incentive compensation plans.
The CPTO Employment Agreement terminates upon death or disability and may be terminated by us with or without cause, and by Mr. McCallum with or without good reason (all as defined in the CPTO Employment Agreement). If the CPTO Employment Agreement is terminated upon the death or disability of Mr. McCallum, he will receive unpaid and accrued base salary through date of termination, unpaid and accrued bonus, and payment of pro rata portion of yearly bonus (if any). In addition, upon termination for disability, Mr. McCallum will receive six (6) months’ severance.
If we terminate Mr. McCallum for cause or Mr. McCallum resigns without good reason, Mr. McCallum will receive only unpaid and accrued base salary through the date of termination and any unpaid and accrued bonus. Should Mr. McCallum be terminated without cause or resign with good reason, Mr. McCallum is entitled to receive unpaid and accrued base salary and unpaid and accrued bonus through termination of the CPTO Employment Agreement, payment of the pro rata portion of yearly bonus, a lump sum payment of six (6) months’ salary, and full vesting of all stock grants.
In addition, if at any time during the term of the CPTO Employment Agreement Mr. McCallum’s employment is terminated after a “Change in Control” (as defined in the CPTO Employment Agreement), compensation is similar to that in a termination without cause or resignation for good reason. In addition, Mr. McCallum will be entitled to receive a lump sum payment equal to the sum of: (i) two (2) times his base salary, bonuses, and the value of certain annual fringe benefits specified in the CPTO Employment Agreement for the year in which Mr. McCallum’s term of employment terminates,
75
and (ii) the value of the portion of his benefits under any savings, pension, profit sharing or deferred compensation plans that are forfeited under those plans by reason of the termination of his employment.
Mr. McCallum’s right to receive any severance benefit under the CPTO Employment Agreement is subject to the execution and delivery to us of a general release of claims in substantially the form attached to the CPTO Employment Agreement.
The CPTO Employment Agreement contains customary non-compete, non-solicitation, and other restrictive covenants to which Mr. McCallum is subject during the term of his employment and for a 12-month period following termination for cause or resignation without good reason.
Andy Schuon – Employment Agreement
We entered into an employment agreement with Andy Schuon, Head of Loop Media Studios (the “HLMS Employment Agreement”), which is effective as of April 1, 2021. Pursuant to the HLMS Employment Agreement, the term of employment is three (3) years, renewable every three (3) years, unless terminated. Mr. Schuon is entitled to receive an annual base salary of $276,000 as well as discretionary bonuses as may be awarded from time to time by the Compensation Committee of the Board, if one exists, or by our Board, and he is entitled to an up-list bonus of $250,000 upon the listing of our common stock on a national securities exchange. Mr. Schuon is eligible to participate in all benefit plans that we offer to our executive officers, including any incentive compensation plans.
The HLMS Employment Agreement terminates upon death or disability and may be terminated by us with or without cause, and by Mr. Schuon with or without good reason (all as defined in the HLMS Employment Agreement). If the HLMS Employment Agreement is terminated upon the death or disability of Mr. Schuon, he will receive unpaid and accrued base salary through date of termination, unpaid and accrued bonus, and payment of pro rata portion of yearly bonus (if any). In addition, upon termination for disability, Mr. Schuon will receive six (6) months’ severance.
If we terminate Mr. Schuon for cause or Mr. Schuon resigns without good reason, Mr. Schuon will receive only unpaid and accrued base salary through the date of termination and any unpaid and accrued bonus. Should Mr. Schuon be terminated without cause or resign with good reason, Mr. Schuon is entitled to receive unpaid and accrued base salary and unpaid and accrued bonus through termination, payment of the pro rata portion of yearly bonus, a lump sum payment of six (6) months’ salary, and full vesting of all stock grants.
In addition, if at any time during the term of the HLMS Employment Agreement Mr. Schuon’s employment is terminated after a “Change in Control” (as defined in the HLMS Employment Agreement), compensation is similar to that in a termination without cause or resignation for good reason. In addition, Mr. Schuon will be entitled to receive a lump sum payment equal to the sum of: (i) two (2) times his base salary, bonuses, and the value of certain annual fringe benefits specified in the HLMS Employment Agreement for the year in which Mr. Schuon’s term of employment terminates, and (ii) the value of the portion of his benefits under any savings, pension, profit sharing or deferred compensation plans that are forfeited under those plans by reason of the termination of his employment.
Mr. Schuon’s right to receive any severance benefit under the HLMS Employment Agreement is subject to the execution and delivery to us of a general release of claims in substantially the form attached to the HLMS Employment Agreement.
The HLMS Employment Agreement contains customary non-compete, non-solicitation, and other restrictive covenants to which Mr. Schuon is subject during the term of his employment and for a 12-month period following termination for cause or resignation without good reason.
76
Outstanding Equity Awards at Fiscal Year-End
The following table sets forth certain information concerning outstanding stock awards held by the Named Executive Officers and our directors as of September 30, 2021:
Name | Number of Securities (#) Exercisable | Option Exercise Price ($) | Option Expiration Date |
|---|---|---|---|
Jon M. Niermann | 1,250,000 (1) | 1.10 | November 10, 2030 |
Liam McCallum | 2,006,751 (2) | 0.66 | October 31, 2028 |
500,000 (3) | 1.10 | November 10, 2030 | |
Andy Schuon | 3,000,000 (4) | 1.10 | November 10, 2030 |
133,333 (5) | 0.57 | March 1, 2031 |
| (1) | Of Mr. Niermann’s options, 468,750 options vested as of September 30, 2021. |
| (2) | Mr. McCallum’s 2,006,751options fully vested and became exercisable on October 31, 2018, the date the award was granted. The number of options and exercise price have been adjusted for the 1 for 1.5 reverse stock split of our common stock that became effective on June 8, 2020. |
| (3) | Of Mr. McCallum’s 500,000 options, 187,500 options vested as of September 30, 2021. |
| (4) | Of Mr. Schuon’s 3,000,000 options, 1,125,000 vested as of September 30, 2021. |
| (5) | Mr. Schuon’s 133,333 options fully vested on March 1, 2021, the date the award was granted. |
Director Compensation
At the time of this filing, directors receive no cash remuneration for their services as directors, nor do we reimburse directors for expenses incurred in their service to the Board.
We have adopted a compensation policy pursuant to which our Board members shall automatically be granted options to purchase shares of our common stock upon joining the Board. The maximum number of shares of common stock granted during a single fiscal year to any director, together with any cash fees paid to such director during the fiscal year shall not exceed a total value of $50,000 (calculating the value of any awards based on the grant date fair value for financial reporting purposes). These stock options shall have a term of ten years and shall have an exercise price equal to 100% of the fair market value of a share of common stock on the date of grant. All options to be granted under this policy will be granted pursuant to 2020 Equity Incentive Plan, including vesting periods, which may vary and are determined by the Board or a committee of the Board. See “Executive Compensation – The Loop Media, Inc. Amended and Restated 2020 Equity Incentive Plan.”
The Loop Media, Inc. Amended and Restated 2020 Equity Incentive Compensation Plan
Our Board and management believe that the effective use of stock-based long-term incentive compensation is vital to our ability to achieve strong performance in the future. The Loop Media, Inc. 2020 Equity Incentive Plan was adopted by the Board on June 15, 2020, amended by the Board on November 10, 2020, and further amended and restated on April 27, 2021, to set the total number of shares of common stock of the Company available under the 2020 Equity Incentive Plan at 14,600,000. On April 27, 2021, pursuant to the April 2021 Written Consent, the Majority Stockholders ratified the 2020 Equity Incentive Plan.
Summary of the 2020 Equity Incentive Plan
The following is a summary of the material features of the 2020 Equity Incentive Plan and is qualified in its entirety by reference to the full text of the 2020 Equity Incentive Plan. Capitalized terms used in this summary and not otherwise defined shall have the meaning set forth in the 2020 Equity Incentive Plan.
77
The 2020 Equity Incentive Plan is intended as an incentive to enable us to (a) attract and retain the types of employees, consultants and directors who will contribute to our long-range success; (b) provide incentives that align the interests of employees, consultants, and directors with those of our stockholders; and (c) promote the success of our business. Awards that may be granted under the 2020 Equity Incentive Plan include: (a) Incentive Stock Options; (b) Non-qualified Stock Options (Incentive Stock Options and Non-qualified Stock Options together referred to as “Options”); (c) Stock Appreciation Rights; (d) Restricted Awards; (e) Performance Share Awards; (f) Cash Awards; and (g) Other Equity-Based Awards (all as defined in the 2020 Equity Incentive Plan, and collectively, “Awards”). As of the date of this Transition Report, we have issued only Non-qualified Stock Options under the 2020 Equity Incentive Plan.
The 2020 Equity Incentive Plan allows a total share reserve of no more than 14,600,000 shares of common stock for the grant of Awards. The 2020 Equity Incentive Plan further provides that no more than 10,000,000 of such shares of common stock may be issued in the aggregate pursuant to the exercise of Incentive Stock Options. The 2020 Equity Incentive Plan is administered by a committee appointed by the Board, or in the Board’s sole discretion, by the Board. Awards are granted by the Board based upon the recommendations of the committee, if the 2020 Equity Incentive Plan is at that time administered by a committee.
Awards may be granted to our employees, consultants and directors and such other individuals designated by the committee who are reasonably expected to become employees, consultants, and directors after the receipt of Awards. Incentive Stock Options may be granted only to our employees, while Awards other than Incentive Stock Options may be granted to our employees, consultants, and directors. As of September 30, 2021, there were four directors and approximately 60 employees and consultants who would be eligible for grants under the 2020 Equity Incentive Plan.
An award of Incentive Stock Options grants the Optionholder the right to purchase a certain number of shares of common stock during a specified term in the future, after a vesting period and/or specific performance conditions, at an exercise price equal to at least 100% of the fair market value (as defined below) of the common stock on the grant date. Such options expire ten years after the grant date. In addition, to the extent that the aggregate fair market value (determined at the time of grant) of common stock with respect to which Incentive Stock Options are exercisable for the first time by any option holder during any calendar year exceeds $100,000, the options or portions thereof which exceed such limit shall be treated as Non-qualified Stock Options. The exercise price for Incentive Stock Options granted to any stockholder who is designated to be a “Ten Percent Shareholder” under the 2020 Equity Incentive Plan shall be at least 110% of the fair market value of the common stock on the date of the grant and such options expire five years after the grant date.
If the common stock is listed on any established stock exchange or a national market system, or is the subject of broker-dealer quotes on an SEC-registered Alternative Trading System, the “fair market value” shall be the closing price of a share of common stock (or if no sales were reported the closing price on the date immediately preceding such date) as quoted on such exchange or system on the day of determination, as reported by such exchange or system. In the absence of an established market for the common stock, the “fair market value” shall be determined in good faith by the committee and such determination shall be conclusive and binding on all persons.
Incentive Stock Options are not transferable (except as specifically provided in the 2020 Equity Incentive Plan in the event of the death of the option holder), and may, during his or her lifetime, only be exercised by the option holder. Non-qualified Stock Options may, in the sole discretion of the committee, be transferable.
The 2020 Equity Incentive Plan does not provide for any specific vesting periods. The committee may, at the time of grant of an Option, determine when that Option will become exercisable and any applicable vesting periods, and may determine that that Option will be exercisable in installments. The Option may be subject to such other terms and conditions on the time or times when it may be exercised (which may be based on performance or other criteria) as the committee may deem appropriate. The vesting provisions of individual Options may vary.
Unless otherwise provided in an Award Agreement or in an employment agreement the terms of which have been approved by the committee, in the event an Optionholder's Continuous Service terminates (other than upon the Optionholder's death or disability), the Optionholder may exercise his or her Option (to the extent that the Optionholder was entitled to exercise such Option as of the date of termination) but only within such period of time ending on the earlier of: (a) the date three months following the termination of the Optionholder's Continuous Service; or (b) the expiration of
78
the term of the Option as set forth in the Award Agreement. Notwithstanding anything to the contrary contained in the 2020 Equity Incentive Plan, if the termination of Continuous Service is by us for Cause, all outstanding Options (whether or not vested) shall immediately terminate and cease to be exercisable. If, after termination, the Optionholder does not exercise his or her Option within the time specified in the Award Agreement, the Option shall terminate.
In accordance with the 2020 Equity Incentive Plan, all of an Optionholder’s Options will immediately fully vest on the date of a Change in Control event (as defined in the 2020 Equity Incentive Plan), subject to the terms of any employment agreement or other contractual arrangement between us and the Optionholder.
Notwithstanding any other provisions in the 2020 Equity Incentive Plan, we may cancel any Award, require reimbursement of any Award by a participant, and effect any other right of recoupment of equity or other compensation provided under the 2020 Equity Incentive Plan in accordance with any Company policies that may be adopted and/or modified from time to time (the "Clawback Policy"). In addition, a participant may be required to repay to us previously paid compensation, whether provided pursuant to the 2020 Equity Incentive Plan or an Award agreement, in accordance with the Clawback Policy.
The Board, at any time, amend or terminate the 2020 Equity Incentive Plan as it shall deem advisable; provided, however, no amendment shall be effective unless approved by our stockholders to the extent stockholder approval is required by applicable law, regulation, or stock exchange rule. It is expressly contemplated in the 2020 Equity Incentive Plan that the Board may amend the 2020 Equity Incentive Plan in any respect the Board deems necessary or advisable to provide eligible employees, consultants and directors with the maximum benefits provided or to be provided under the provisions of the Internal Revenue Code of 1986 and the regulations promulgated thereunder (the “Code”) relating to Incentive Stock Options or to the non-qualified deferred compensation provisions of Section 409A of the Code and/or to bring the 2020 Equity Incentive Plan and/or Awards granted under it into compliance therewith.
The committee at any time, and from time to time, may amend the terms of any one or more Awards; provided, however, that the committee may not affect any amendment which would otherwise constitute an impairment of the rights under any Award unless: (a) we request the consent of the participant; and (b) the participant consents in writing.
The 2020 Equity Incentive Plan became effective as of January 29, 2020 (the “Effective Date”). The terms of the 2020 Equity Incentive Plan provide that no Award shall be exercised (or, in the case of a stock Award, shall be granted) unless and until the 2020 Equity Incentive Plan has been approved by our stockholders, which approval was obtained on April 27, 2021, by the Majority Stockholders pursuant to the April 2021 Written Consent. The 2020 Equity Incentive Plan shall terminate automatically ten years from the Effective Date. No Award shall be granted pursuant to the 2020 Equity Incentive Plan after such date, but Awards theretofore granted may extend beyond that date. No Awards may be granted under the 2020 Equity Incentive Plan while it is suspended or after it is terminated.
Of the total 14,600,000 shares of common stock originally reserved for awards under the 2020 Equity Incentive Plan, as of December 27, 2021, 1,667,751 shares of common stock remain reserved for future awards.
The Loop Media, Inc. Amended and Restated 2016 Equity Incentive Plan
Prior to us adopting the 2020 Equity Incentive Plan, we issued awards under the Loop Media, Inc. Amended and Restated 2016 Equity Incentive Plan, which was adopted by the Board and approved by stockholders June 7, 2016, and amended and restated by the Board and stockholders October 4, 2016 (the “2016 Stock Option Plan”). The total number of shares reserved and available for grant under the 2016 Stock Option Plan was 10,000,000 shares of common stock.
At the time of the Merger with Predecessor Loop, Predecessor Loop stockholders received one newly issued share of our common stock in exchange for each share of Predecessor Loop common stock. See “Management’s Discussion and Analysis of Financial Condition and Results of Operations – Overview and Corporate History.” According to the Merger Agreement, each option to purchase shares of Predecessor Loop common stock pursuant to the 2016 Stock Option Plan that was outstanding immediately prior to the time that the Merger took effect ceased to be outstanding and was converted into and exchanged for an option to purchase an equivalent number of shares of our common stock pursuant to the terms of the 2016 Stock Option Plan, which was assumed by us.
79
As a result of the Merger, no further awards of any type available under the 2016 Stock Option Plan may be granted. As of December 27, 2021, there were outstanding options exercisable for an aggregate of 5,812,307 shares of common stock pursuant to the 2016 Stock Option Plan.
ITEM 12. SECURITY OWNERSHIP OF CERTAIN BENEFICIAL OWNERS AND MANAGEMENT AND RELATED STOCKHOLDER MATTERS.
As of December 27, 2021, there were 133,470,141 shares of common stock outstanding and 200,000 shares of Series B Preferred Stock outstanding.
The following table sets forth, as of December 27, 2021, ownership of our voting securities that are beneficially owned by:
| - | each person, or group of affiliated persons, known by us to beneficially own more than 5% of any class of our voting securities; |
| - | each of our Named Executive Officers; |
| - | each of our directors; and |
| - | all of our executive officers and directors as a group. |
Information relating to beneficial ownership of the voting securities by our principal stockholders and management is based upon each person’s information using “beneficial ownership” concepts under the SEC rules. Under these rules, a person is deemed to be a beneficial owner of a security if that person has or shares voting power, which includes the power to vote or direct the voting of the security, or investment power, which includes the power to vote or direct the voting of the security. For purposes of computing the number and percentage of shares beneficially owned by a security holder, any shares which such person has the right to acquire within 60 days of December 27, 2021, are deemed to be outstanding, but those shares are not deemed to be outstanding for the purpose of computing the percentage ownership of any other security holder.
80
Under the SEC rules, more than one person may be deemed to be a beneficial owner of the same securities and a person may be deemed to be a beneficial owner of securities as to which he or she may not have any pecuniary beneficial interest. Except as noted below, ownership consists of sole ownership, voting and investment rights, and the address for each stockholder listed is c/o Loop Media, Inc., 700 N. Central Ave., Suite 430, Glendale, CA 91203.
| Amount of Beneficial Ownership of Common Stock | Amount of Beneficial Ownership of Series B | ||
|---|---|---|---|---|
Preferred Stock (1) | ||||
Name and Address of Beneficial Holder | Number of Shares Owned | Percent of Class | Number of Shares Owned | Percent of Class |
5% Stockholders |
|
|
|
|
Dreamcatcher, LLC (2) | 14,656,545 | 10.7% | — | — |
1879 Hazelton Drive | ||||
Germantown, TN 38138 | ||||
Running Wind, LLC (3) | 14,656,545 | 10.7% | — | — |
1879 Hazelton Drive | ||||
Germantown, TN 38138 | ||||
Jeremy Boczulak (4) | 11,756,406 | 8.4% | — | — |
1345 Sweetwater Drive | ||||
Brentwood, TN 37027 | ||||
Named Executive Officers and Directors |
|
| ||
Jon Niermann, Chief Executive Officer, Chairman & Director (5) | 20,000,000 | 15% | — | — |
Liam McCallum, Chief Product and Technical Officer (6) | 6,006,751 | 4.4% | — | — |
Andy Schuon, Head of Loop Media Studios | 104,700 (7) | * | — | — |
Bruce A. Cassidy, Director (8) | 31,138,822 | 19.8% | 200,000 | 100.0% |
Denise A. Penz, Director | 130,000 | * | — | — |
Sonya Zilka, Director | - — | * | — | — |
Executive Officers and Directors as a Group | 57,380,273 | 36.0% | 200,000 | 100.0% |
* Indicates less than 1% of class.
| (1) | Holders of Series B Preferred Stock are entitled to 100 non-cumulative votes per share on all matters submitted to a vote by stockholders of our common stock, including the election of directors and all other matters as required by law, and each share of Series B Preferred Stock has a liquidation preference of $1.00 per share, is entitled to 100 votes per share and is convertible at any time at the discretion of the holder thereof into 100 shares of our common stock. As a result, 200,000 shares of outstanding Series B Preferred Stock represent 20,000,000 votes on all matters submitted to a vote of stockholders. |
| (2) | Dreamcatcher, LLC’s beneficial ownership includes (i) 10,768,695 shares of common stock, (ii) 1,775,354 shares of common stock issuable upon exercise of warrants exercisable within 60 days of December 27, 2021, and (iii) 2,112,496 shares of common stock underlying the 2023 Notes convertible into shares of common stock within 60 days of December 27, 2021, based on the outstanding principal and interest of $1,267,498 as of December 27, 2021 and the conversion price of $0.60 per share. |
| (3) | Running Wind, LLC’s beneficial ownership includes (i) 10,768,695 shares of common stock, (ii) 1,775,354 shares of common stock issuable upon exercise of warrants exercisable within 60 days of December 27, 2021, and (iii) 2,112,496 shares of common stock underlying the 2023 Notes convertible into shares of common stock within 60 days of December 27, 2021, based on the outstanding principal and interest of $1,267,498 as of December 27, 2021 and the conversion price of $0.60 per share. |
| (4) | Mr. Boczulak’s beneficial ownership includes (A) 2,767,389 shares of common stock held in his name; (B) (i) 1,231,846 shares of common stock and (ii) 5,453,512 shares of common stock issuable upon exercise of warrants exercisable within 60 days of December 27, 2021, held by Sake TN, LLC, of which Mr. Boczulak is the sole owner and Manager; and (C) (i) 1,503,711 shares of common stock and (ii) 799,948 shares of common stock issuable upon exercise of warrants exercisable within 60 days of December 27, 2021, held by Sunnybrook Investment LLC, of which Mr. Boczulak is the sole owner and Manager. |
| (5) | Mr. Niermann’s beneficial ownership includes 20,000,000 shares of common stock held by Pioneer Productions, 420 |
81
| 8th Street, Huntington Beach, CA 92648, of which Mr. Niermann is the Sole Member. |
| (6) | Mr. McCallum’s beneficial ownership includes (i) 4,000,000 shares of common stock held by 500 Limited, 13D Tak Lee Commercial Bldg., 113-117 Wanchai Road, Wanchai, Hong Kong, of which Mr. McCallum is the Owner and Chief Executive Officer, and (ii) 2,006,751 shares of common stock underlying options exercisable within 60 days of December 27, 2021. |
| (7) | Mr. Schuon’s beneficial ownership includes 104,700 shares of common stock held by the Andrew Mark Schuon and Amanda Erin Schuon, Trustees of the Schuon 2014 Trust, of which Mr. Schuon is the Trustee. |
| (8) | Mr. Cassidy’s beneficial ownership includes (A) (i) 967,982 shares of common stock; (ii) 200,000 shares of Series B Preferred Stock, convertible into 20,000,000 shares of common stock; (iii) 68,182 shares of common stock issuable upon exercise of warrants exercisable within 60 days of December 27, 2021; and (iv) 301,000 shares of common stock underlying the 2022 Notes convertible into shares of common stock within 60 days of December 27, 2021, based on the outstanding principal and interest of $801,941 as of December 27, 2021, and the conversion price of $2.66 per share, held by The Bruce A. Cassidy 2013 Irrevocable Trust dated June 18, 2013, an Ohio Legacy Trust, of which Mr. Cassidy is the Grantor; (B) (i) 6,036,637 shares of common stock, (ii) 465,455 shares of common stock issuable upon exercise of warrants exercisable within 60 days of December 27, 2021; and (iii) 632,899 shares of common stock underlying the 2022 Notes convertible into shares of common stock within 60 days of December 27, 2021, based on the outstanding principal and interest of $1,686,204 as of December 27, 2021, and the conversion price of $2.66 per share, held by the Excel Family Partnership LLP, of which Mr. Cassidy is the Manager; and (C) 2,666,667 shares of common stock issuable upon exercise of warrants exercisable within 60 days of December 27, 2021, held by Eagle Investment Group, LLC, of which Mr. Cassidy is the Manager. |
Equity Compensation Plan Information
According to the terms of our 2020 Equity Incentive Plan, 14,600,000 shares of common stock were originally authorized for awards to be made under the 2020 Equity Incentive Plan. As of September 30, 2021, there were 2,578,951 shares remaining available for awards under the 2020 Equity Incentive Plan.
Options granted in the future under the 2020 Equity Incentive Plan are within the discretion of our Board of Directors. The following table summarizes the number of shares of our common stock authorized for issuance under our equity compensation plans as of September 30, 2021.
Plan Category | Number of securities to be issued upon exercise of outstanding options, warrants and rights (a) | Weighted-average exercise price of outstanding options, warrants and rights (b) | Number of securities remaining available for future issuance under equity compensation plans (excluding securities reflected in column (a) (c) |
Equity compensation plans approved by security holders (1) | 17,833,356 | $ 1.04 | 2,578,951 |
|
|
|
|
Equity compensation plans not approved by security holders (2) | 0 | $ 0 | 0 |
|
|
|
|
Total | 17,833,356 | $ 1.04 | 2,578,951 |
| (1) | Of this total, 5,812,307 awards were granted under the Loop Media, Inc. Amended and Restated 2016 Equity Incentive Plan, which was adopted by the Board and approved by stockholders on June 7, 2016, and amended and restated by the Board and approved by stockholders October 4, 2016. No further awards of any type available under this plan may be granted. See “Executive Compensation – The Loop Media, Inc. Amended and Restated 2016 Equity Incentive Plan.” |
| (2) | All securities remaining available for future issuance will be made in accordance with the 2020 Equity Incentive Plan, which was ratified by the holders of a majority of our outstanding voting stock (the “Majority Stockholders”) pursuant to the Majority Written Consent of Stockholders in Lieu of Annual Meeting dated April 27, 2021 (the “April 2021 Written Consent”). |
82
ITEM 13. CERTAIN RELATIONSHIPS AND RELATED TRANSACTIONS, AND DIRECTOR INDEPENDENCE.
Related Party Transactions
SEC rules require us to disclose any transaction since the beginning of our last fiscal year, or any currently proposed transaction, in which we are a participant and in which any related person has or will have a direct or indirect material interest involving the lesser of $120,000 or one percent (1%) of the average of our total assets as of the end of last two completed fiscal years. A related person is any executive officer, director, nominee for director or holder of 5% or more of our common stock, or an immediate family member of any of those persons.
The Merger
In connection with the Merger, the Company entered into a Restricted Stock Purchase Agreement dated February 5, 2020, with an entity controlled by Bruce Cassidy, a member of our current board of directors for the sale and issuance of 200,000 shares of Series B Preferred Stock, which was newly established by the Company.
In consideration for issuance of the Series B Preferred Stock to the entity controlled by Mr. Cassidy, this entity agreed to: (i) pay the Company $1,000,000 in immediately payable funds; (ii) transfer to the Company 40,000,000 shares of the Company's common stock, all of which were retired and restored to the status of authorized and unissued shares; (iii) transfer to the Company 1,769,333 shares of the Company's Series A Preferred Stock, all of which were retired and restored to the status of authorized and unissued shares; and (iv) forgive debt in the amount of $1,000,000 in principal and all accrued and unpaid interest due thereunder evidenced by a promissory note dated December 18, 2019, made jointly by Predecessor Loop and its then wholly-owned subsidiary ScreenPlay.
In addition, on February 5, 2020, we assumed a note in the principal amount of $180,000 owed to Mr. Cassidy by Interlink. The $180,000 debt plus accrued interest of $5,563 was retired on March 11, 2020, as a part of the issuance of 2,666,667 warrants to purchase shares of our common stock. The warrants are exercisable for ten (10) years and are exercisable at $0.75 per share.
The 2023 Notes
We have borrowed funds for business operations from two of our stockholders, Dreamcatcher, LLC and Running Wind, LLC, each of which is a beneficial holder of more than 5% of our common stock, through convertible debt agreements. Each Convertible Promissory Note was originally issued on December 5, 2018, on identical terms in the principal amount of $1,500,000, and each was amended and restated October 31, 2019, and October 23, 2020. The 2023 Notes carry interest at 10% per annum beginning on November 1, 2020, with monthly payments of unpaid interest accrued at 12.5% per annum to be paid in arrears through March 31, 2021, and mature on December 1, 2023. Beginning April 1, 2021, we began paying equal monthly installments of principal and interest on the 2023 Notes at 10% per annum. The 2023 Notes have aggregate remaining balances, including accrued interest, amounting to approximately $2.72 million and $3.23 million as of the nine months ended September 30, 2021, and the twelve months ended December 31, 2020, respectively. We incurred interest expense for the 2023 Notes in the amounts of approximately $0.247 million and $0.300 million for the nine months ended September 30, 2021, and the twelve months ended December 31, 2020, respectively. The 2023 Notes are convertible at any time prior to the maturity in whole or in part into shares of our common stock at a price of $0.60 per share. As of December 27, 2021, a total of $2,534,995 in principal and interest on the 2023 Notes was outstanding.
In November 2019, we also issued warrants to each of Dreamcatcher, LLC and Running Wind, LLC, to purchase 1,775,354 shares of our common stock, for an aggregate of 3,550,709 shares of our common stock, exercisable at $0.86 per share for a period of 10 years.
83
The 2022 Notes
From December 1, 2020 to June 1, 2021, we sold in a private placement, (i) $3,000,000 in aggregate principal amount of Senior Secured Promissory Notes and (ii) warrants to purchase 272,727 shares of our common stock at an exercise price of $2.75 per share. The investors in this offering included entities controlled by Mr. Cassidy, who is a member of our board of directors. In connection with the offering, the entities controlled by Mr. Cassidy purchased an aggregate of $2,350,000 principal amount of the 2022 Notes and warrants to purchase an aggregate of 213,637 shares of our common stock at $2.75 per share. The warrants have a term of 10 years. The 2022 Notes mature on December 1, 2022. The 2022 Notes accrue interest in two different ways: (A) at the rate of 4% per annum, payable in cash, from the date of issuance of each note as follows: (1) interest from the issue date to November 30, 2021 is payable in advance on the date the note was executed; (2) six months of cash interest is payable in arrears on June 1, 2022; and (3) six months of cash interest is payable in arrears on the maturity date; and (B) at the rate of 6% per annum, payable in shares of our common stock in arrears on June 1, 2021, December 1, 2021, June 1, 2022, and the maturity date. As of December 27, 2021, a total of $3,105,884 in principal and interest was outstanding on the 2022 Notes.
The 2020 and 2021 Share Offering
Beginning on August 15, 2020, and through May 18, 2021, we offered and sold in a private placement to accredited investors $6,705,000 of shares of common stock at a price of $1.25 per share. The investors in this offering included an entity controlled by Mr. Cassidy, who is a member of our board of directors, which invested $1.2 million for a total of 960,000 shares of common stock.
The 2021 Share and Warrant Offering
On September 30, 2021, we entered into securities purchase agreements with accredited investors pursuant to which we sold, in a private offering (i) an aggregate of 5,773,460 shares of our common stock and (ii) warrants to purchase up to an aggregate of 6,573,460 shares of common stock. Each investor was entitled to purchase one share of common stock and one warrant to purchase one share of common stock for an aggregate purchase price of $1.25. The warrants were immediately exercisable, have a three-year term and an exercise price of $2.75 per share. The investors in the offering included an entity controlled by Mr. Cassidy, who is a member of our board of directors. The entity controlled by Mr. Cassidy purchased 320,000 shares of common stock and warrants to purchase 320,000 shares of common stock in the offering, for gross proceeds of $400,000. Other investors in this offering were entities controlled by Jeremy Boczulak, who, as a result of these investments, became a beneficial holder of more than 5% of our common stock. Pursuant to the terms of this offering, an investor who purchased more than 50% of the total offering amount in the offering was entitled to receive warrants to purchase an additional 800,000 shares of common stock. That investor was an entity controlled by Mr. Boczulak. In total, the entities controlled by Mr. Boczulak purchased 5,453,460 shares of common stock and warrants to purchase 6,253,460 shares of common stock in the offering, for gross proceeds of $6,816,825.
500 Limited
For the nine months ended September 30, 2021, and the twelve months ended December 31, 2020, we paid 500 Limited $235,835 and $287,200, respectively, for programming services provided to Loop. 500 Limited is an entity controlled by Liam McCallum, our Chief Product and Technology Officer.
Related Person Transaction Approval Policy
While we do not currently have a written policy regarding the approval of transactions between us and a related person, as a matter of appropriate corporate governance, our Board of Directors, acting through the acting through the audit committee or, in certain circumstances, the chairman of the audit committee, reviews and approves all transactions between us and our executive officers, directors, nominees for election as a director, beneficial owners of more than 5% of any class of our common stock, any members of the immediate family of any of the foregoing persons and any firms, corporations or other entities in which any of the foregoing persons is employed or is a partner or principal or in a similar position or in which such person has a 5% or greater beneficial ownership interest, or related parties. Any request for us to enter into a transaction with a related party, in which the amount involved exceeds $120,000 and such related party
84
would have a direct or indirect interest is first presented to our audit committee, or in certain circumstances the chairman of our audit committee, for review, consideration and approval. In approving or rejecting any such proposal, our audit committee is to consider the material facts of the transaction, including, but not limited to, whether the transaction is on terms no less favorable than terms generally available to an unaffiliated third party under the same or similar circumstances, the extent of the benefits to us, the availability of other sources of comparable products or services and the extent of the related person’s interest in the transaction.
Director Independence
We are not currently subject to listing requirements of any national securities exchange or inter-dealer quotation system that has requirements that a majority of our board members be “independent.” We have, however, considered the Marketplace Rules of The Nasdaq Stock Market and the independence requirements contemplated by Rule 10A-3 of the Exchange Act. Under the listing requirements and rules of Nasdaq, independent directors must constitute a majority of a listed company’s board of directors within 12 months after listing. Under the rules of Nasdaq, a director will only qualify as an “independent director” if, in the opinion of that company’s board of directors, that person does not have a relationship that would interfere with the exercise of independent judgment in carrying out the responsibilities of a director. In order to be considered independent for purposes of Rule 10A-3 of the Exchange Act, a member of an audit committee of a listed company may not, other than in his or her capacity as a member of the audit committee, the board of directors, or any other board committee, accept, directly or indirectly, any consulting, advisory, or other compensatory fee from the listed company or any of its subsidiaries or otherwise be an affiliated person of the listed company or any of its subsidiaries.
Our Board of Directors has determined that Mr. Cassidy, Ms. Penz, and Ms. Zilka are “independent directors” as such term is defined by Nasdaq Rule 5605(a)(2).
85
ITEM 14. PRINCIPAL ACCOUNTANT FEES AND SERVICES.
Audit Fees
The aggregate fees billed to us by our principal accountants, Marcum LLP, for professional services rendered during the twelve months ended December 31, 2019, and 2020, and the nine months ended September 30, 2021, are set forth in the table below:
Fee Category | Nine months ending |
| Twelve months ending |
| Twelve months ending | |||
Audit fees (1) | $ | 304,640 | $ | 609,527 | $ | 143,450 | ||
Audit-related fees (2) |
| — |
| — |
| — | ||
Tax fees (3) | — | — | — | |||||
All other fees (4) | — | — | — | |||||
| (1) | Audit fees consist of fees incurred for professional services rendered for the audit of financial statements, for reviews of our interim consolidated financial statements included in our quarterly reports on Form 10-Q, and for services that are normally provided in connection with statutory or regulatory filings or engagements. |
| (2) | Audit-related fees consist of fees billed for professional services that are reasonably related to the performance of the audit or review of our financial statements but are not reported under “Audit fees.” |
| (3) | Tax fees consist of fees billed for professional services relating to tax compliance, tax planning, and tax advice. |
| (4) | All other fees consist of fees billed for services not associated with audit or tax. |
Pre-Approval Practices and Procedures
Given the small size of our board of directors, our board of directors acts as our audit committee. Our board pre-approves all audit and permissible non-audit services, generally for up to one year. These services may include audit services, audit-related services, tax services, and other services. Our board may also approve particular services on a case-by-case basis.
86
PART IV
ITEM 15. EXHIBITS AND FINANCIAL STATEMENT SCHEDULES.
Exhibits
Exhibit |
| Exhibit Description |
|---|---|---|
|
|
|
2.1 | ||
2.2 | ||
2.3 | ||
2.4 | ||
2.5 | ||
2.6 | ||
2.7 | ||
3.1 | ||
3.2 | ||
4.1 | ||
4.2 | ||
4.3 | ||
4.4 | ||
4.5 | ||
87
Exhibit |
| Exhibit Description |
|---|---|---|
4.6 | ||
10.1 | ||
10.2 | ||
10.3† | ||
10.4† | ||
10.5† | ||
10.6† | ||
10.7 | ||
10.8 | ||
10.9 | ||
10.10 | ||
10.11 | ||
10.12 | ||
10.13† | ||
88
Exhibit |
| Exhibit Description |
|---|---|---|
10.14† | ||
18 | ||
21.1 | ||
24.1 | ||
31.1* | ||
31.2* | ||
32.1** | ||
32.2** | ||
99.1* | ||
101.INS | Inline XBRL Instance Document | |
101.SCH | Inline XBRL Taxonomy Extension Schema Document | |
101.CAL | Inline XBRL Taxonomy Extension Calculation Linkbase Document | |
101.DEF | Inline XBRL Taxonomy Extension Definition Linkbase Document | |
101.LAB | Inline XBRL Taxonomy Extension Label Linkbase Document | |
101.PRE | Inline XBRL Taxonomy Extension Presentation Linkbase Document | |
104 | Cover Page Interactive Data File (formatted as Inline XBRL and contained in Exhibit 101) |
* | Filed herewith. |
** | Furnished herewith. |
*** | Filed herewith; portions of the exhibit have been omitted pursuant to Item 601(b)(10) of Regulation S-K. A copy of any omitted portions will be furnished to the Securities and Exchange Commission upon request. |
# | The schedules and exhibits to this agreement have been omitted pursuant to Item 601(b)(2) of Regulation S-K. A copy of any omitted schedule and/or exhibit will be furnished to the Securities and Exchange Commission upon request. |
89
† | Indicates a management contract or compensation plan, contract or arrangement. |
Financial Statements
The following documents are filed as part of this Form 10-K, as set forth on the Index to Financial Statements found on page F-1.
| ● | Report of Independent Registered Public Accounting Firm (Marcum LLP) |
| ● | Consolidated Balance Sheets as of September 30, 2021, and December 31, 2020 |
| ● | Consolidated Statements of Operations for the nine months ended September 30, 2021, and 2020 |
| ● | Consolidated Statement of Changes in Stockholders’ Equity for the nine months ended September 30, 2021, and December 31, 2020 |
| ● | Consolidated Statements of Cash Flows for the nine months ended September 30, 2021, and 2020 |
| ● | Notes to Consolidated Financial Statements |
Financial Statement Schedules
All financial statement schedules are omitted because they are not applicable, or the required information is shown in the financial statements or notes thereto.
90
SIGNATURES
Pursuant to the requirements of Section 13 or 15(d) of the Securities Exchange Act of 1934, as amended, the registrant has duly caused this Amendment No. 1 to the Transition Report to be signed on its behalf by the undersigned thereunto duly authorized.
| Loop Media, Inc., a Nevada corporation | |
| (Registrant) | |
|
| |
February 1, 2022 | By: | /s/ Jon Niermann |
|
| Jon Niermann |
|
| Chief Executive Officer |
|
| (Principal Executive Officer) |
|
|
|
February 1, 2022 | By: | /s/ Neil Watanabe |
|
| Neil Watanabe |
|
| Chief Financial Officer |
|
| (Principal Financial and Accounting Officer) |
Pursuant to the requirements of the Securities Exchange Act of 1934, as amended, this Amendment No. 1 to the Transition Report has been signed below by the following persons on behalf of the registrant and in the capacities and on the dates indicated.
Signature |
| Title |
| Date |
|
|
|
|
|
/s/ Jon Niermann |
|
|
|
|
Jon Niermann |
| Chief Executive Officer, Chairman and Director |
| February 1, 2022 |
|
|
|
|
|
/s/ Neil Watanabe | Chief Financial Officer (Principal Financial and Accounting Officer) | February 1, 2022 | ||
Neil Watanabe | ||||
/s/ Bruce Cassidy |
|
|
|
|
Bruce Cassidy |
| Director |
| February 1, 2022 |
/s/ Denise Penz | ||||
Denise Penz | Director | February 1, 2022 | ||
/s/ Sonya Zilka | ||||
Sonya Zilka | Director | February 1, 2022 |
92
INDEX TO CONSOLIDATED FINANCIAL STATEMENTS
LOOP MEDIA, INC. AUDITED CONSOLIDATED FINANCIAL STATEMENTS
F-1 | |
Consolidated Balance Sheets as of September 30, 2021, and December 31, 2020 | F-3 |
F-4 | |
F-5 | |
F-6 | |
F-8 |
93
REPORT OF INDEPENDENT REGISTERED PUBLIC ACCOUNTING FIRM
To the Stockholders and Board of Directors of
Loop Media, Inc.
Opinion on the Financial Statements
We have audited the accompanying consolidated balance sheets of Loop Media, Inc. (the “Company”) as of September 30, 2021 and December 31, 2020, the related consolidated statements of operations, changes in stockholders’ equity and cash flows for the nine months ended September 30, 2021 and the year ended December 31, 2020, and the related notes (collectively referred to as the “financial statements”). In our opinion, the financial statements present fairly, in all material respects, the financial position of the Company as of September 30, 2021 and December 31, 2020, and the results of its operations and its cash flows for the nine months ended September 30, 2021 and the year ended December 31, 2020, in conformity with accounting principles generally accepted in the United States of America.
Explanatory Paragraph – Change in Accounting Policy
As more fully described in Note 2, the Company changed its accounting policy for impairment of goodwill by modifying the annual goodwill impairment testing date from December 31 to September 30.
Explanatory Paragraph – Going Concern
The accompanying financial statements have been prepared assuming that the Company will continue as a going concern. As more fully described in Note 1, the Company has incurred significant losses and needs to raise additional funds to meet its obligations and sustain its operations. These conditions raise substantial doubt about the Company's ability to continue as a going concern. Management's plans in regard to these matters are also described in Note 1. The financial statements do not include any adjustments that might result from the outcome of this uncertainty.
Basis for Opinion
These financial statements are the responsibility of the Company's management. Our responsibility is to express an opinion on the Company's financial statements based on our audits. We are a public accounting firm registered with the Public Company Accounting Oversight Board (United States) ("PCAOB") and are required to be independent with respect to the Company in accordance with the U.S. federal securities laws and the applicable rules and regulations of the Securities and Exchange Commission and the PCAOB.
We conducted our audits in accordance with the standards of the PCAOB. Those standards require that we plan and perform the audits to obtain reasonable assurance about whether the financial statements are free of material misstatement, whether due to error or fraud. The Company is not required to have, nor were we engaged to perform, an audit of its internal control over financial reporting. As part of our audits we are required to obtain an understanding of internal control over financial reporting but not for the purpose of expressing an opinion on the effectiveness of the Company's internal control over financial reporting. Accordingly, we express no such opinion.
Our audits included performing procedures to assess the risks of material misstatement of the financial statements, whether due to error or fraud, and performing procedures that respond to those risks. Such procedures included examining, on a test basis, evidence regarding the amounts and disclosures in the financial statements. Our audits also included evaluating the accounting principles used and significant estimates made by management, as well as evaluating the overall presentation of the financial statements. We believe that our audits provide a reasonable basis for our opinion.
Critical Audit Matters
The critical audit matter communicated below is a matter arising from the current period audit of the financial statements that was communicated or required to be communicated to the audit committee and that: (1) relates to accounts or
F-1
disclosures that are material to the financial statements and (2) involved our especially challenging, subjective, or complex judgments. The communication of critical audit matters does not alter in any way our opinion on the financial statements, taken as a whole, and we are not, by communicating the critical audit matter below, providing separate opinions on the critical audit matter or on the accounts or disclosures to which they relate.
Impairment Assessment for EON Media Group
As described in Note 8 to the financial statements, the Company performed its annual evaluation of goodwill for the EON Media Group reporting unit for impairment by comparing the estimated fair value of the EON Media Group reporting unit to its carrying value. The Company used a combination of income approach using a discounted cash flow model and a market approach using guideline public company methods to determine the estimated fair value of the EON Media Group reporting unit.
The principal considerations for our determination that performing procedures relating to evaluating the recoverability of the carrying value of goodwill is a critical audit matter, are that there is significant judgment by management in the estimation of (a) the inputs and assumptions used in the income approach; (b) the selection of appropriate guideline public companies and the appropriate multiples; and (c) the relative weights used for the two approaches. This in turn led to high degree of auditor judgment, subjectivity and effort in performing audit procedures in evaluating audit evidence related to management’s estimates and assumptions used in the forecasted revenue and model. Also, the evaluation of audit evidence related to goodwill impairment required significant auditor judgment as the nature of the evidence is often subjective, and the audit effort involved the use of professionals with specialized skill and knowledge to assist in evaluating the audit evidence obtained.
Addressing the matter involved performing procedures and evaluating evidence in connection with forming our overall audit opinion on the consolidated financial statements. These procedures included, among others, (i) evaluating management’s inputs and assumptions used in the discounted cash flows model; (ii) evaluating management’s determination of guideline companies and market multiple used in the market approach; and (iii) evaluating the relative weight used in management’s model. Professionals with specialized skill and knowledge were used to assist in the evaluation of the measurement of the Company’s estimated fair value of the EON Media Group reporting unit.
/s/ Marcum LLP
Marcum LLP
We have served as the Company’s auditor since 2020
Costa Mesa, California
January 21, 2022
F-2
LOOP MEDIA, INC.
CONSOLIDATED BALANCE SHEETS
As of |
| As of | |||
September 30, 2021 | December 31, 2020 | ||||
ASSETS | |||||
Current assets |
|
|
| ||
Cash | $ | | $ | | |
Accounts receivable, net |
| |
| | |
Inventory |
| |
| | |
Prepaid expenses and other current assets |
| |
| | |
Prepaid income tax |
| |
| | |
License content assets - current | | | |||
Note receivable - current |
| — |
| | |
Total current assets |
| |
| | |
Non-current assets |
|
|
|
| |
Deposits |
| |
| | |
License content assets - non current | | | |||
Equipment, net |
| |
| | |
Operating lease right-of-use assets |
| |
| | |
Intangible assets, net |
| |
| | |
Note receivable |
| — |
| | |
Equity method investments | — | | |||
Goodwill |
| |
| | |
Total non-current assets |
| |
| | |
Total assets | $ | | $ | | |
LIABILITIES AND STOCKHOLDERS’ EQUITY | |||||
Current liabilities |
|
|
|
| |
Accounts payable and accrued liabilities | $ | | $ | | |
Payable on acquisition |
| |
| | |
License content liabilities - current | | | |||
Note payable - current | | | |||
Deferred Income |
| |
| | |
Convertible debt related party - current, net |
| |
| | |
Convertible debt – current, net |
| — |
| | |
Lease liability - current |
| |
| | |
Total current liabilities | $ | | $ | | |
Non-current liabilities |
|
|
|
| |
Convertible debt – related party, less current portion, net | $ | | $ | | |
Convertible debt, less current portion, net |
| |
| | |
Note payable – non-current |
| |
| | |
Derivative liability | | — | |||
License content liabilities - non current | — | | |||
Lease liability |
| |
| | |
Total non-current liabilities | $ | | $ | | |
Total liabilities | $ | | $ | | |
Commitments and contingencies (Note 13) |
|
| |||
Stockholders’ equity | |||||
Series B Convertible Preferred stock, $ | | | |||
Series A Convertible Preferred stock, $ |
| — |
| | |
Common Stock, $ |
| |
| | |
Common stock subscribed and not yet issued |
| — |
| | |
Additional paid in capital |
| |
| | |
Accumulated deficit |
| ( |
| ( | |
Total stockholders' equity |
| |
| | |
Total liabilities and stockholders' equity | $ | | $ | | |
See the accompanying notes to the consolidated financial statements
F-3
LOOP MEDIA, INC.
CONSOLIDATED STATEMENTS OF OPERATIONS
For the nine months ended September 30, | For the twelve months ended December 31, | |||||
| 2021 |
| 2020 | |||
Revenue | $ | | $ | | ||
Cost of revenue |
| |
| | ||
Gross profit |
| |
| | ||
Operating expenses |
|
|
|
| ||
Selling, general and administrative |
| |
| | ||
Impairment of goodwill and intangibles | | | ||||
Total operating expenses |
| |
| | ||
Loss from operations |
| ( |
| ( | ||
Other income (expense) |
|
|
|
| ||
Interest income |
| |
| | ||
Interest expense |
| ( |
| ( | ||
Gain/(loss) on foreign currency translation | | — | ||||
Gain on extinguishment of debt, net | | — | ||||
Gain on settlement of obligation | — | | ||||
Loss on settlement of obligation | — | ( | ||||
Inducement expense |
| — |
| ( | ||
Change in fair value of derivatives | | — | ||||
Other income |
| — |
| | ||
Total other income (expense) |
| ( |
| ( | ||
Income tax (expense)/benefit |
| |
| ( | ||
Net loss | $ | ( | $ | ( | ||
Deemed dividend |
| — |
| ( | ||
Net loss attributable to common stockholders | $ | ( | $ | ( | ||
Basic and diluted net loss per common share | $ | ( | $ | ( | ||
Weighted average number of common shares outstanding | | | ||||
See the accompanying notes to the consolidated financial statements
F-4
LOOP MEDIA, INC.
CONSOLIDATED STATEMENTS OF CHANGES IN STOCKHOLDERS’ EQUITY
FOR THE NINE MONTHS ENDED September 30, 2021 and YEAR ENDED December 31, 2020
1 for
Preferred Stock Series B | Preferred Stock Series A | Common Stock | Common stock | Additional Paid | Accumulated | ||||||||||||||||||||||
Shares | Amount | Shares | Amount | Shares | Amount | subscriptions | in Capital | Deficit | Total | ||||||||||||||||||
Balances, December 31, 2019 |
| — |
| $ | — |
| — |
| $ | — |
| |
| $ | |
| $ | |
| $ | |
| $ | ( |
| $ | |
Shares issued for cash |
| — |
| — |
| — |
| — |
| |
| |
| — |
| |
| — |
| | |||||||
Cash received for common stock subscribed |
| — |
| — |
| — |
| — |
| — | — | | — | — |
| | |||||||||||
Issuance of common stock subscribed |
| — |
| — |
| — |
| — |
| | | ( | | — |
| — | |||||||||||
Shares issued for consulting fees |
| — |
| — |
| — |
| — |
| | | — | | — |
| | |||||||||||
Shares issued in conjunction with reverse merger |
| — |
| — |
| |
| |
| | | — | ( | — |
| ( | |||||||||||
Shares issued for cash | | | — | — | — | — | — | | — | | |||||||||||||||||
Shares issued in conjunction with debt settlement | | | — | — | — | — | — | | — | | |||||||||||||||||
Warrants issued for settlement of debt to related party | — | — | — | — | — | — | — | | — | | |||||||||||||||||
Deemed Dividend | — | — | — | — | — | — | — | ( | — | ( | |||||||||||||||||
Shares issued for asset purchase | — | — | — | — | | | — | | — | | |||||||||||||||||
Beneficial conversion feature of convertible debt | — | — | — | — | — | — | — | | — | | |||||||||||||||||
Stock-based compensation | — | — | — | — | — | — | — | | — | | |||||||||||||||||
Warrants issued to consultant | — | — | — | — | — | — | — | | — | | |||||||||||||||||
Shares issued for debt settlement | — | — | — | — | | | — | | — | | |||||||||||||||||
Shares issued for license content assets | — | — | — | — | | | — | | — | | |||||||||||||||||
Shares issued for equity investment in unconsolidated entity | — | — | — | — | | | — | | — | | |||||||||||||||||
Net loss |
| — |
| — |
| — |
| — |
| — |
| — |
| — |
| — |
| ( |
| ( | |||||||
Balances, December 31, 2020 |
| | $ | |
| | $ | |
| | $ | | $ | | $ | | $ | ( | $ | | |||||||
Issuance of common stock subscribed |
| — |
| — |
| — |
| — |
| |
| |
| ( |
| |
| — |
| — | |||||||
Conversion of convertible debenture |
| — |
| — |
| — |
| — |
| |
| |
| — |
| |
| — |
| | |||||||
Shares issued for cash |
| — |
| — |
| — |
| — |
| |
| |
| — |
| |
| — |
| | |||||||
Stock-based compensation | — |
| — |
| — |
| — | — | — | — | | — | | ||||||||||||||
Warrants issued in conjunction with debenture | — |
| — |
| — |
| — | — | — | — | | — | | ||||||||||||||
Conversion feature of convertible debenture revalued to fair value | — |
| — |
| — |
| — | — | — | — | ( | — | ( | ||||||||||||||
Shares issued for consulting fees | — |
| — |
| — |
| — | | | — | | — | | ||||||||||||||
Shares issued for acquisition | — |
| — |
| — |
| — | | | — | | — | | ||||||||||||||
Warrants issued for severance | — | — | — | — | — | — | — | | — |
| | ||||||||||||||||
Payment in kind interest stock issuance | — | — | — | — | | | — | | — | | |||||||||||||||||
Conversion of series A convertible stock to common stock | — | — | ( | ( | | | — | ( | — | — | |||||||||||||||||
Shares and warrants issued for cash | — | — | — | — | | | — | | — | | |||||||||||||||||
Net loss |
| — |
| — |
| — |
| — |
| — |
| — |
| — |
| — |
| ( |
| ( | |||||||
BALANCES, September 30, 2021 |
| | $ | |
| — | $ | ( |
| | $ | | $ | — | $ | | $ | ( | $ | | |||||||
See the accompanying notes to the consolidated financial statements
F-5
LOOP MEDIA, INC.
CONSOLIDATED STATEMENTS OF CASH FLOWS
Nine months ended September 30, | Twelve months ended December 31, | |||||
| 2021 |
| 2020 | |||
CASH FLOWS FROM OPERATING ACTIVITIES |
|
|
|
| ||
Net loss | $ | ( | $ | ( | ||
Adjustments to reconcile net loss to net cash used in operating activities: |
|
|
|
| ||
Amortization of debt discount |
| |
| | ||
Depreciation and amortization expense |
| |
| | ||
Amortization of license contract assets | | — | ||||
Amortization of right-of-use assets |
| |
| | ||
Bad debt expense | | | ||||
Gain on extinguishment of debt | ( | — | ||||
Change in fair value of derivative | ( | — | ||||
Warrants issued for severance | | — | ||||
Stock-based compensation |
| |
| | ||
Common stock issued to consultants | | — | ||||
Gain on settlement of obligations | — | ( | ||||
Loss on settlement of obligations | — | | ||||
Goodwill tax benefit for acquisitions | ( | — | ||||
Inducement expense |
| — |
| | ||
Impairment of intangible assets |
| |
| | ||
Change in operating assets and liabilities: |
|
|
| |||
Accounts receivable |
| ( |
| ( | ||
Prepaid income tax | | | ||||
Inventory |
| ( |
| ( | ||
Prepaid expenses |
| ( |
| ( | ||
Deposit |
| ( |
| — | ||
Accounts payable and accrued liabilities |
| |
| | ||
License content liability |
| ( |
| — | ||
License contract asset | ( | ( | ||||
Operating lease liabilities |
| ( |
| ( | ||
Deferred income |
| ( |
| | ||
NET CASH USED IN OPERATING ACTIVITIES |
| ( |
| ( | ||
CASH FLOWS FROM INVESTING ACTIVITIES |
|
|
|
| ||
Acquisition of EON Media Group, net of cash acquired |
| ( |
| ( | ||
Purchase of equipment | ( | ( | ||||
Collection of note receivable |
| — |
| | ||
NET CASH USED IN INVESTING ACTIVITIES |
| ( |
| ( | ||
CASH FLOWS FROM FINANCING ACTIVITIES |
|
|
|
| ||
Proceeds from issuance of common stock | | | ||||
Proceeds from issuance of preferred stock | — | | ||||
Proceeds from PPP loan | | | ||||
Proceeds from the issuance of shares and warrants | | — | ||||
Proceeds from issuance of convertible debt | | | ||||
Repayment of stockholder loans |
| ( |
| ( | ||
Share issuance costs |
| — |
| ( | ||
Proceeds from issuing common stock subscribed |
| — |
| | ||
NET CASH PROVIDED BY FINANCING ACTIVITIES |
| |
| | ||
Change in cash and cash equivalents |
| |
| ( | ||
Cash, beginning of the year |
| |
| | ||
Cash, end of the year | $ | | $ | | ||
SUPPLEMENTAL DISCLOSURES OF CASH FLOW STATEMENTS |
|
|
|
| ||
Cash paid for interest | $ | | $ | | ||
Cash paid for income taxes | $ | | $ | — | ||
F-6
SUPPLEMENTAL DISCLOSURES OF NON CASH INVESTING AND FINANCING ACTIVITIES |
|
|
|
| ||
Assumption of office lease by related party | $ | — | $ | | ||
Common stock issued to acquire intangible assets | $ | — | $ | | ||
Common stock issued for license content assets | $ | — | $ | | ||
Preferred shares issued for debt settlement | $ | — | $ | | ||
Conversion of convertible debenture to common stock | $ | | $ | — | ||
Common stock issued for acquisition | $ | | $ | — | ||
Shares and warrants issued | $ | | $ | — | ||
Common stock issued for equity investment in unconsolidated entity | $ | — | $ | | ||
Accrued interest rolled into convertible note | $ | — | $ | | ||
Assumption of debt as part of reverse merger | $ | — | $ | | ||
Warrants issued to extinguish debt with related party | $ | — | $ | | ||
Common stock issued in connection with reverse merger | $ | — | $ | | ||
Preferred stock issued in connection with reverse merger | $ | — | $ | | ||
Payment in kind common stock payment | $ | | $ | — | ||
Warrants issued as debt discount on convertible debenture | $ | | $ | — | ||
Beneficial conversion feature recorded as debt discount | $ | ( | $ | | ||
Conversion of Preferred Class A stock to common stock | $ | | $ | — | ||
Shares issued for common stock subscribed | $ | | $ | | ||
Deemed dividend | $ | — | $ | |
See the accompanying notes to the consolidated financial statements
F-7
LOOP MEDIA, INC.
NOTES TO CONSOLIDATED FINANCIAL STATEMENTS
NINE MONTHS ENDED SEPTEMBER 30, 2021 AND YEAR ENDED DECEMBER 31, 2020
NOTE 1 – BUSINESS
Loop Media Inc. (the “Company”; formerly Interlink Plus, Inc.) is a Nevada corporation. The Company was incorporated under the laws of the State of Nevada on May 11, 2015. On February 5, 2020, the Company and the Company’s wholly owned subsidiary, Loop Media Acquisition, Inc. (“Merger Sub”), a Delaware corporation, closed the Agreement and Plan of Merger (the “Merger Agreement”) with Loop Media, Inc. (“Loop”), a Delaware corporation. Pursuant to the Merger Agreement, Merger Sub merged with and into Loop with Loop as surviving entity and becoming a wholly-owned subsidiary of the Company (the “Merger”).
Pursuant to the Merger Agreement, the Company acquired
In connection with the Merger, on February 6, 2020, the Company entered into a Purchase Agreement (the “Asset Purchase Agreement”) with Zixiao Chen (“Buyer”) for the purchase of assets relating to the Company’s
In 2019 Loop owned
On January 24, 2020 the Company merged SPE with and into the Company. The certificate of merger was issued by the State of Washington on January 24, 2020 and the certificate of ownership and merger was issued by the State of Delaware on January 24, 2020. For accounting purposes, Loop was the surviving entity. The transaction was accounted for as a recapitalization of Loop pursuant to which Loop was treated as the accounting acquirer, surviving and continuing entity although the Company is the legal acquirer. The Company did not recognize goodwill or any intangible assets in connection with the Merger. Accordingly, the Company’s historical financial statements are those of Loop and its wholly-owned subsidiary, ScreenPlay, immediately following the consummation of this reverse merger transaction.
On June 8, 2020, a
Change in Fiscal Year
On November 12, 2021, the Board of Directors of the Company approved a change in its fiscal year end from December 31st to September 30th. As a result, the Company’s results of operations, cash flows, and all transactions impacting shareholders equity presented in this Transition Report on Form 10-KT are for the nine months ended September 30, 2021, whereas its fiscal year 2020 are for the twelve months ended December 31, 2020, unless otherwise noted. As such, the Company’s fiscal year 2021, or fiscal 2021, refers to the period from January 1, 2021, to September 30, 2021.
F-8
Going concern and management’s plans
As of September 30, 2021, the Company had cash of $
The Company’s primary source of operating funds since inception has been cash proceeds from debt and equity financing transactions. The ability of the Company to continue as a going concern is dependent upon its ability to generate sufficient revenue and its ability to raise additional funds by way of its debt and equity financing efforts.
The accompanying consolidated financial statements have been prepared on a going concern basis, which contemplates the realization of assets and the satisfaction of liabilities in the normal course of business. These consolidated financial statements do not include any adjustments relating to the recovery of the recorded assets or classification of the liabilities that might be necessary should the Company be unable to continue as a going concern. The ability of the Company to continue as a going concern is dependent on management’s further implementation of the Company’s on-going and strategic plans, which include continuing to raise funds through equity and/or debt raises. Should the Company be unable to raise adequate funds, certain aspects of the on-going and strategic plans may require modification. Management is in the process of identifying sources of capital via strategic partnerships, debt refinancing and equity investments through one or more private placements.
COVID-19
The continuing spread of COVID-19 around the world is affecting the United States and global economies and has affected our operations and those of third parties on which we rely, including disruptions in staffing, order fulfillment and demand for product. In addition, the COVID-19 pandemic has and may continue to affect our revenue significantly. Additionally, while the potential economic impact brought by, and the duration of the COVID-19 pandemic is difficult to assess or predict, the impact of the COVID-19 pandemic on the global financial markets may reduce our ability to access capital, which could negatively impact our short-term and long-term liquidity. The continuing impact of the COVID-19 pandemic is highly uncertain and subject to change.
As COVID-19 continues to evolve, the extent to which the coronavirus impacts operations will depend on future developments, which are highly uncertain and cannot be predicted with confidence, including the duration and severity of the outbreak, and the actions that may be required to contain the coronavirus or treat its impact. The Company continues to monitor the pandemic and, the extent to which the continued spread of the virus adversely affects our customer base and therefore revenue. As the COVID-19 pandemic is complex and rapidly evolving, the Company’s plans as described above may change. At this point, the Company cannot reasonably estimate the duration and severity of this pandemic, which could have a material adverse impact on the business, results of operations, financial position, and cash flows.
NOTE 2 – SUMMARY OF SIGNIFICANT ACCOUNTING POLICIES
Basis of presentation
The consolidated financial statements include the accounts of the Company and its wholly-owned subsidiary, EON Media Group. These consolidated financial statements are prepared using the accrual basis of accounting in accordance with accounting principles generally accepted in the United States (“GAAP”). All inter-company transactions and balances have been eliminated on consolidation.
Use of estimates
The preparation of the consolidated financial statements in conformity with GAAP requires management to make estimates and assumptions that affect the reported amounts of assets and liabilities and disclosure of contingent assets and liabilities at the date of the financial statements and the reported amounts of revenue and expenses during the reporting period. Actual results could differ from those estimates.
F-9
Significant estimates include assumptions used in the fair value of stock-based compensation, the fair value of warrants, fair value of intangible assets, recoverability of goodwill and intangible assets.
Business combinations
The Company accounts for business acquisitions under Accounting Standards Codification (“ASC”) 805, Business Combinations. The total purchase consideration for an acquisition is measured as the fair value of the assets given, equity instruments issued and liabilities assumed on the acquisition date. Costs that are directly attributable to the acquisition are expenses as incurred. Identifiable assets (including intangible assets), liabilities assumed (including contingent liabilities) and noncontrolling interests in an acquisition are measured initially at their fair values on the acquisition date. The Company recognizes goodwill if the fair value of the total purchase consideration and any noncontrolling interest is in excess of the net fair value of the identifiable assets and the liabilities assumed. The results of operations of the acquired business are included in the consolidated financial statements beginning on the acquisition date.
Variable interest entities (“VIE”)
Variable interests are contractual, ownership or other monetary interests in an entity that change with fluctuations in the fair value of the entity’s net assets exclusive of variable interests. A VIE can arise from items such as lease agreements, loan arrangements, guarantees or service contracts. An entity is a VIE if (a) the entity lacks sufficient equity or (b) the entity’s equity holders lack power or the obligation and right as equity holders to absorb the entity’s expected losses or to receive its expected residual returns.
If an entity is determined to be a VIE, the entity must be consolidated by the primary beneficiary. The primary beneficiary is the holder of the variable interests that has the power to direct the activities of a VIE that most significantly impact the VIE’s economic performance and has the obligation to absorb losses of or the right to receive benefits from the VIE that could potentially be significant to the VIE. Therefore, the Company must identify which activities most significantly impact the VIE’s economic performance and determine whether it, or another party, has the power to direct those activities. As of September 30, 2021, and December 31, 2020, the Company had
Segment reporting
The Company reports as
Cash
Cash and cash equivalents include all highly liquid monetary instruments with original maturities of three months or less when purchased. These investments are carried at cost, which approximates fair value. Financial instruments that potentially subject the Company to concentrations of credit risk consist primarily of cash deposits. The Company maintains its cash in institutions insured by the Federal Deposit Insurance Corporation (“FDIC”). At times, the Company’s cash and cash equivalent balances may be uninsured or in amounts that exceed the FDIC insurance limits. The Company has not experienced any loses on such accounts. On September 30, 2021, and December 31, 2020, the Company had
As of September 30, 2021, and December 31, 2020, approximately $
Accounts receivable
Accounts receivable represent amounts due from customers. The Company assesses the collectability of receivables on an ongoing basis. A provision for the impairment of receivables involves significant management judgement and includes the review of individual receivables based on individual customers, current economic trends and
F-10
analysis of historical bad debts. As of September 30, 2021, and December 31, 2020, the Company had recorded an allowance for doubtful accounts of $
Concentration of credit risk
The Company grants credit in the normal course of business to its customers. Periodically, the Company reviews past due accounts and makes decisions about future credit on a customer by customer basis. Credit risk is the risk that one party to a financial instrument will cause a loss for the other party by failing to discharge an obligation.
The Company’s concentration of credit risk was not significant as of September 30, 2021, and December 31, 2020.
Inventory
Inventories are valued at the lower of cost or net realizable value. The Company purchases inventory from a vendor and all inventory purchased is deemed finished goods. Cost is determined using the first-in-first-out basis for finished goods. Net realizable value is determined on the basis of anticipated sales proceeds less the estimated selling expenses. Management compares the cost of inventories with the net realizable value and an allowance is made to write down inventories to net realizable value, if lower. As of September 30, 2021, and December 31, 2020, the Company has recorded
Prepaid expenses
Expenditures paid in one accounting period which will not be consumed until a future period such as insurance premiums and annual subscription fees are accounted for on the balance sheet as a prepaid expense. When the asset is eventually consumed, it is charged to expense.
License Content Asset
On January 1, 2020, the Company adopted the guidance in ASU 2019-02, Entertainment—Films—Other Assets—Film Costs (Subtopic 926-20) and Entertainment—Broadcasters—Intangibles—Goodwill and Other (Subtopic 920-350): Improvements to Accounting for Costs of Films and License Agreements for Program Materials, on a prospective basis. The Company capitalizes the fixed content fees and its corresponding liability when the license period begins, the cost of the content is known, and the content is accepted and available for streaming. If the licensing fee is not determinable or reasonably estimable, no asset or liability is recorded, and licensing costs are expensed as incurred. The Company amortizes licensed content assets into cost of revenue, using the straight-line method over the contractual period of availability. The liability is paid in accordance with the contractual terms of the arrangement.
Equity method investments
The Company accounts for investments in unconsolidated entities under the equity method of accounting if it can exercise significant influence over the operating and financial policies of an entity but does not have a controlling financial interest. Judgment regarding the level of influence over each equity method investment includes considering key factors such as ownership interest, representation on the board of directors, participation in policy-making decisions and material intercompany transactions. The Company’s proportionate share of the net income (loss) resulting from these investments are reported under the line-item captioned equity method investment income in our Consolidated Statements of Operations. The carrying value of our equity method investments is reported in equity method investments in the Consolidated Balance Sheets. The Company’s equity method investments are reported at cost and adjusted each period for the Company’s share of the investee’s income or loss and dividend paid, if any. The Company assesses investments for impairment whenever events or changes in circumstances indicate that the carrying value of an investment may not be recoverable.
F-11
Goodwill and other intangible assets
Goodwill represents the excess of the purchase consideration over the fair value of the net tangible and identifiable intangible assets acquired in a business combination. Goodwill and other intangible assets determined to have an indefinite useful life are not amortized but are subject to impairment tests. The Company conducts its annual impairment tests or whenever events and changes in circumstances suggest that the carrying amount may not be recoverable. The Company conducted the annual impairment test on September 30, 2021. This is a change in accounting principle as the timing of the annual impairment test in prior periods was for the twelve months ended December 31, 2020. The Company deems the change of impairment test timing to be appropriate as this aligns with the Company’s new budgetary process.
When evaluating goodwill and indefinite-lived intangible assets for impairment, the Company may first perform an assessment of qualitative factors to determine if the fair value of the reporting unit or the intangible asset is more-likely-than-not greater than the carrying amount. Significant factors considered in this assessment include, but are not limited to, macro-economic conditions, market and industry conditions, cost considerations, the competitive environment, overall financial performance, and results of past impairment tests. If, based on a review of the qualitative factors, the Company determines it is more-likely-than-not that the fair value is greater than the carrying value, the Company may bypass a quantitative test for impairment.
In performing the quantitative test for impairment of goodwill, the Company compares the fair value of each reporting unit with it carrying amount, including goodwill, in order to identify a potential impairment. Measurement of the fair value of a reporting unit is based on a fair value measure using the sum of the discounted estimated future cash flows. Estimates of forecasted cash flows involve measurement uncertainty, and it is therefore possible that reductions in the carrying value of goodwill may be required in the future because of changes in management’s future cash flow estimates. When the fair value of a reporting unit is less than it carrying amount, goodwill of the reporting unit is considered to be impaired. Effective January 1, 2020, the Company adopted the guidance in Accounting Standards Update (“ASU”) 2017-04, Simplifying the Test for Goodwill Impairment, which measures impairment amount as the excess of a reporting unit’s carrying amount over its fair value as determined by the quantitative test.
The Company measures impairment of indefinite-lived intangible assets, which consist of brand name, based on projected discounted cash flows. The Company also re-evaluates the useful life of the brand name to determine whether events and circumstances continue to support an indefinite useful life. The Company charged Eon goodwill $
Long-lived assets
The Company evaluates the recoverability of long-lived assets, other than goodwill and indefinite-lived intangible assets, for impairment when events or changes in circumstances indicate that the carrying amount of an asset may not be recoverable. Conditions that would necessitate an impairment assessment include a significant decline in the observable market value of an asset, a significant change in the extent or manner that an asset is used, or a significant adverse change that would indicate that the carrying amount of an asset or group of assets is not recoverable. For long-lived assets to be held and used, the Company recognizes an impairment loss only if their carrying amount is not recoverable through the undiscounted cash flows. The impairment loss is based on the difference between the carrying amount and estimated fair value as determined by discounted future cash flows. The Company’s finite long-lived intangible assets are amortized on a straight-line basis over their estimated useful lives, which range from to
Property and equipment, net
Property and equipment are stated at cost, less accumulated depreciation. Depreciation is calculated using the straight-line method over the asset’s estimated useful life. The capitalization policy for the company is to capitalize
F-12
property and equipment purchases greater than $
See below for estimated useful lives:
Equipment |
| |
Software |
|
Operating leases
The Company determines if an arrangement is a lease at inception. Operating lease right-of-use assets (“ROU assets”) and short-term and long-term lease liabilities are included on the face of the consolidated balance sheet.
ROU assets represent the right to use an underlying asset for the lease term and lease liabilities represent the Company’s obligation to make lease payments arising from the lease. Operating lease ROU assets and liabilities are recognized at commencement date based on the present value of lease payments over the lease term. As most of the Company’s leases do not provide an implicit rate, the Company uses an incremental borrowing rate based on the information available at commencement date in determining the present value of lease payments. The Company’s lease terms may include options to extend or terminate the lease when it is reasonably certain that the Company will exercise that option. Lease expense for lease payments is recognized on a straight-line basis over the lease term. The Company has lease agreements with lease and non-lease components, which are accounted for as a single lease component. For lease agreements with terms less than 12 months, the Company has elected the short-term lease measurement and recognition exemption, and it recognizes such lease payments on a straight-line basis over the lease term.
Fair value measurement
The company determines the fair value of its assets and liabilities using a hierarchy established by the accounting guidance that prioritizes the inputs to valuation techniques used to measure fair value. The hierarchy gives the highest priority to valuations based upon unadjusted quoted prices in active markets for identical assets or liabilities (Level 1 measurements) and the lowest priority to valuations based upon unobservable inputs that are significant to the valuation (Level 3 measurements). The three levels of valuation hierarchy are defined as follows:
| ● | Level 1 inputs to the valuation methodology are quoted prices for identical assets or liabilities in active markets. |
| ● | Level 2 inputs to the valuation methodology included quoted prices for similar assets and liabilities in active markets, quoted prices for identical or similar assets in inactive markets, and inputs that are observable for the asset or liability, either directly or indirectly, for substantially the full term of the financial instrument. |
| ● | Level 3 inputs to the valuation methodology is one or more unobservable inputs which are significant to the fair value measurement. |
The carrying value of financial assets and liabilities recorded at fair value is measured on a recurring or nonrecurring basis. Financial assets and liabilities measured on a non-recurring basis are those that are adjusted to fair value when a significant event occurs. The Company had no financial assets or liabilities carried and measured on a nonrecurring basis during the reporting periods. Financial assets and liabilities measured on a recurring basis are those that are adjusted to fair value each time a financial statement is prepared. The derivative liabilities are recognized at fair value on a recurring basis at September 30, 2021 and are Level 3 measurements. There have been no transfers between levels.
F-13
The following table summarizes changes in fair value measurements of the Derivative Liability during the nine months ended September 30, 2021:
Quoted Prices in |
| Significant |
| ||||||||
Active Markets | Significan Other | Unobservable | |||||||||
For Identical Items | Observable Inputs | Inputs | |||||||||
(Level 1) | (Level 2) | (Level 3) | Total | ||||||||
Derivative liabilities | — | — | | | |||||||
Total | $ | — | $ | — | $ | | $ | |
The following table summarizes changes in fair value measurements of the Derivative Liability during the nine months ended September 30, 2021:
|
| |||
Balance as of December 31, 2020 | $ | | ||
Derivative liability issued with convertible debentures |
| | ||
| ( | |||
Balance as of September 30, 2021 | $ | | ||
The following table summarizes the unobservable inputs used in the valuation of the derivatives during the nine months ended September 30, 2021:
Expected term | |
Discount rate | |
Volatility |
Convertible debt and derivative treatment
When the Company issues debt with a conversion feature, we must first assess whether the conversion feature meets the requirements to be treated as a derivative, as follows: a) one or more underlyings, typically the price of our common stock; b) one or more notional amounts or payment provisions or both, generally the number of shares upon conversion; c) no initial net investment, which typically excludes the amount borrowed; and d) net settlement provisions, which in the case of convertible debt generally means the stock received upon conversion can be readily sold for cash. An embedded equity-linked component that meets the definition of a derivative does not have to be separated from the host instrument if the component qualifies for the scope exception for certain contracts involving an issuer’s own equity. The scope exception applies if the contract is both a) indexed to its own stock; and b) classified in shareholders’ equity in its statement of financial position.
If the conversion feature within convertible debt meets the requirements to be treated as a derivative, we estimate the fair value of the convertible debt derivative using the Monte Carlo Method upon the date of issuance. If the fair value of the convertible debt derivative is higher than the face value of the convertible debt, the excess is immediately recognized as interest expense. Otherwise, the fair value of the convertible debt derivative is recorded as a liability with an offsetting amount recorded as a debt discount, which offsets the carrying amount of the debt. The convertible debt derivative is revalued at the end of each reporting period and any change in fair value is recorded as a gain or loss in the statement of operations. The debt discount is amortized through interest expense over the life of the debt.
Convertible debt and beneficial conversion features
If the conversion feature is not treated as a derivative, the Company assesses whether it is a beneficial conversion feature (“BCF”). A BCF exists if the conversion price of the convertible debt instrument is less than the stock price on the commitment date. This typically occurs when the conversion price is less than the fair value of the stock on the date the instrument was issued. The value of a BCF is equal to the intrinsic value of the feature, the difference between the conversion price and the common stock into which it is convertible and is recorded as additional paid in capital and as a
F-14
debt discount in the consolidated balance sheets. The Company amortizes the balance over the life of the underlying debt as amortization of debt discount expense in the consolidated statements of operations. If the debt is retired early, the associated debt discount is then recognized immediately as amortization of debt discount expense in the consolidated statements of operations.
If the conversion feature does not qualify for either the derivative treatment or as a BCF, the convertible debt is treated as traditional debt.
Advertising costs
The Company expenses all advertising costs as incurred. Advertising and marketing costs for the nine months ended September 30, 2021, and 2020, were $
Revenue recognition
The Company recognizes revenue in accordance with ASC 606, Revenue from Contracts with Customers, when it satisfies a performance obligation by transferring control over a product to a customer. Revenue is measured based on the consideration the Company expects to receive in exchange for those products. In instances where final acceptance of the product is specified by the customer, revenue is deferred until all acceptance criteria have been met. Revenues are recognized under Topic 606 in a manner that reasonably reflects the delivery of the Company’s products and services to customers in return for expected consideration and includes the following elements:
| ● | executed contracts with the Company’s customers that it believes are legally enforceable; |
| ● | identification of performance obligations in the respective contract; |
| ● | determination of the transaction price for each performance obligation in the respective contract; |
| ● | allocation of the transaction price to each performance obligation; and |
| ● | recognition of revenue only when the Company satisfies each performance obligation. |
Performance obligations and significant judgments
The Company’s revenue streams can be categorized into the following performance obligations and recognition patterns:
| o | Delivery of streaming services including content encoding and hosting. The Company recognizes revenue over the term of the service based on bandwidth usage. |
| o | Delivery of subscription content services in customized formats. The Company recognizes revenue over the term of the service. |
| o | Delivery of hardware for ongoing subscription content delivery through software. The Company recognizes revenue at the point of hardware delivery. |
| o | Revenue share arrangements, where platform providers distribute the Company’s licensed content and providers pay the Company a portion of the usage-based advertising revenues. |
Transaction prices for performance obligations are explicitly outlined in relevant agreements; therefore, the Company does not believe that significant judgments are required with respect to the determination of the transaction price, including any variable consideration identified.
F-15
Customer acquisition costs
The Company records commission expense associated with subscription revenue. Commissions are included in operating expenses. The Company has elected the practical expedient that allows the Company to recognize the incremental costs of obtaining a contract as an expense when incurred if the amortization period of the asset that the Company otherwise would have recognized is one year or less.
Cost of revenue
Cost of revenue represents the cost of the delivered hardware and related bundled software and is recognized at the time of sale. For ongoing licensing and hosting fees, cost of sales is recognized over time based on usage patterns.
Deferred income
The Company bills subscription services in advance of when the service period is performed. The deferred income recorded at September 30, 2021 and December 31, 2020, represents the Company’s accounting for the timing difference between when the subscription fees are received and when the performance obligation is satisfied.
Net loss per share
The Company accounts for net loss per share in accordance with ASC subtopic 260-10, Earnings Per Share (“ASC 260-10”), which requires presentation of basic and diluted earnings per share (“EPS”) on the face of the statement of operations for all entities with complex capital structures and requires a reconciliation of the numerator and denominator of the basic EPS computation to the numerator and denominator of the diluted EPS.
Basic net loss per share is computed by dividing net loss attributable to common stockholders by the weighted average number of shares of common stock outstanding during each period. It excludes the dilutive effects of any potentially issuable common shares.
Diluted net loss per share is calculated by including any potentially dilutive share issuances in the denominator.
The following securities are excluded from the calculation of weighted average diluted shares at September 30, 2021, and December 31, 2020, respectively, because their inclusion would have been anti-dilutive.
| September 30, |
| December 31, | |
2021 | 2020 | |||
Options to purchase common stock |
| |
| |
Warrants to purchase common stock |
| |
| |
Series A preferred stock |
| — |
| |
Series B preferred stock |
| |
| |
Convertible debentures |
| |
| |
Total common stock equivalents |
| |
| |
Shipping and handling costs
A shipping and handling fee is charged to customers and recorded as revenue at the time of sale. The associated cost of shipping and handling is recorded as a cost of revenue at the time of service.
Income taxes
The Company accounts for income taxes in accordance with ASC Topic 740, Income Taxes. ASC 740 requires a company to use the asset and liability method of accounting for income taxes, whereby deferred tax assets are recognized for deductible temporary differences, and deferred tax liabilities are recognized for taxable temporary differences. Temporary differences are the differences between the reported amounts of assets and liabilities and their tax bases.
F-16
Deferred tax assets are reduced by a valuation allowance when, in the opinion of management, it is more likely than not that some portion, or all of, the deferred tax assets will not be realized. Deferred tax assets and liabilities are adjusted for the effect of changes in tax laws and rates on the date of enactment.
Under ASC 740, a tax position is recognized as a benefit only if it is “more likely than not” that the tax position would be sustained in a tax examination, with a tax examination being presumed to occur. The amount recognized is the largest amount of tax benefit that is greater than 50% likely of being realized on examination. For tax positions not meeting the “more likely than not” test, no tax benefit is recorded. The Company has no material uncertain tax positions for any of the reporting periods presented.
Stock-based compensation
Share-based compensation issued to employees is measured at the grant date, based on the fair value of the award, and is recognized as an expense over the requisite service period. The Company measures the fair value of the share-based compensation issued to non-employees using the stock price observed in the trading market (for stock transactions) or the fair value of the award (for non-stock transactions), which were more reliably determinable measures of fair value than the value of the services being rendered. The measurement date is the earlier of (1) the date at which commitment for performance by the counterparty to earn the equity instruments is reached, or (2) the date at which the counterparty’s performance is complete.
Recently adopted accounting pronouncements
In March 2019, the FASB issued ASU 2019-02, Entertainment—Films—Other Assets—Film Costs (Subtopic 926-20) and Entertainment— Broadcasters—Intangibles—Goodwill and Other (Subtopic 920-350): Improvements to Accounting for Costs of Films and License Agreements for Program Materials, in order to align the accounting for production costs of an episodic television series with the accounting for production costs of films by removing the content distinction for capitalization. ASU 2019-02 also requires that an entity reassess estimates of the use of a film in a film group and account for any changes prospectively. In addition, ASU 2019-02 requires that an entity test films and license agreements for program material for impairment at a film group level when the film or license agreements are predominantly monetized with other films and license agreements. The ASU is effective for interim and annual periods beginning after December 15, 2019. The Company deemed the license agreement guidance applicable for broadcasters, and so adopted the guidance in ASU 2019-02 prospectively on January 1, 2020. Content assets are predominantly monetized as a group and therefore are reviewed in aggregate at a group level when an event or change in circumstances indicates a change in the expected usefulness of the content or that the fair value may be less than unamortized cost. The Company reviews various qualitative factors and indicators to assess whether the group asset is impaired.
Accounting standards issued but not yet effective
In September 2016, the FASB issued ASU 2016-13, Financial Instruments - Credit Losses (Topic 326): Measurement of Credit Losses on Financial Instruments. This guidance requires the measurement of all expected credit losses for financial assets held at the reporting date based on historical experience, current conditions and reasonable and supportable forecasts. This guidance also requires enhanced disclosures regarding significant estimates and judgments used in estimating credit losses. The new guidance is effective for fiscal years beginning after December 15, 2022. While the Company is currently evaluating the impact that the adoption of this guidance will have on its consolidated financial statements, it does not expect the adoption to have a material impact on its consolidated financial statements.
In August 2020, the FASB issued ASU 2020-06, Debt – Debt with Conversion and Other Options (Subtopic 470-20) and Derivatives and Hedging – Contracts in Entity’s Own Equity (Subtopic 815-40). This ASU reduces the number of accounting models for convertible debt instruments and convertible preferred stock. As well as amend the guidance for the derivatives scope exception for contracts in an entity’s own equity to reduce form-over-substance-based accounting conclusions. In addition, this ASU improves and amends the related EPS guidance. The ASU is effective for interim and annual periods beginning after December 15, 2021, with early adoption permitted for periods beginning after December 15, 2020. Adoption of the ASU can either be on a modified retrospective or full retrospective basis. The Company is currently evaluating the impact of this standard on its consolidated financial statements and related disclosures.
F-17
NOTE 3. BUSINESS COMBINATION
Business acquisition of EON Media Group
The Company obtained control of EON Media Group through two investments, which ASC 805 refers to as a “business combination achieved in stages.” On December 1, 2020, the Company acquired from Ithaca EMG Holdco LLC (Ithaca)
On April 27, 2021, the Company acquired from Far West Entertainment
The allocation of the purchase consideration is as follows:
| April 27, | ||
2021 | |||
Fair value of shares issued | $ | | |
Cash consideration |
| | |
Fair value of prior investment in EON Media Group |
| | |
Total consideration paid | $ | | |
The purchase price allocation is as follows:
| April 27, | ||
2021 | |||
Cash and cash equivalents | $ | | |
Goodwill |
| | |
Brand name intangible asset |
| | |
Current liabilities | ( | ||
Total purchase price allocation | $ | | |
The proforma disclosures of revenues and expenses of the combined entities, showing the EON acquisition occurring at of the beginning of the 2021 and 2020 were not materially different from the actual reported results in 2021 and 2020, respectively.
From April 27, 2021, to September 30, 2021, EON recognized revenue of $
F-18
NOTE 4 – INVENTORY
The Company’s finished goods inventory consisted of the following on September 30, 2021, and December 31, 2020:
| September 30, |
| December 31, | |||
2021 | 2020 | |||||
Computers | $ | | $ | | ||
Hasp keys |
| |
| — | ||
Loop player |
| |
| | ||
Total inventory | $ | | $ | | ||
NOTE 5 – NOTE RECEIVABLE
On December 23, 2014, SPI entered a promissory note receivable whereby it advanced $
NOTE 6 – LICENSE CONTENT ASSETS
License Content Assets
To stream video content to the users, the Company generally secures intellectual property rights to such content by obtaining licenses from, and paying royalties or other consideration to, rights holders or their agents. The licensing arrangements can be for a fixed fee, variable fee, or combination of both. The licensing arrangements specify the period when the content is available for streaming. The license content assets are
As of September 30, 2021, license content assets were $
The Company recorded amortization expense of $
License Content Liabilities
On September 30, 2021, the Company had $
F-19
NOTE 7 – PROPERTY AND EQUIPMENT
The Company’s property and equipment consisted of the following as of September 30, 2021, and December 31, 2020:
| September 30, |
| December 31, | |||
2021 | 2020 | |||||
Equipment | $ | | $ | | ||
Software |
| |
| | ||
| |
| | |||
Less: accumulated depreciation |
| ( |
| ( | ||
Total, equipment net | $ | | $ | | ||
Depreciation expense, calculated using straight line method, charged to operations amounted to $
NOTE 8. GOODWILL AND OTHER INTANGIBLE ASSETS
As of September 30, 2021, and December 31, 2020, the balance of goodwill was $
The Company’s other intangible assets, each definite lived assets, consisted of the following as of September 30, 2021, and December 31, 2020:
September 30, |
| December 31, | ||||||
| Useful life |
| 2021 |
| 2020 | |||
Customer relationships | $ | | $ | | ||||
Content library |
| |
| | ||||
Technology | — | | ||||||
Total intangible assets, gross |
| |
| | ||||
Less: accumulated amortization |
| ( |
| ( | ||||
Total |
| ( |
| ( | ||||
Total intangible assets, net | $ | | $ | | ||||
In April 2021, the Company acquired EON in a step business acquisition (see Note 3)’ and the associated EON brand name intangible valued at $
In October 2020, the Company acquired from Spkr Inc. assets that consisted of single asset acquisition of $
Amortization expense charged to operations amounted to $
F-20
Annual amortization expense for the next five years and thereafter is estimated to be $
NOTE 9 – LEASES
Operating leases
The Company has operating leases for office space and office equipment. Many leases include one or more options to renew, some of which include options to extend the leases for a long-term period, and some leases include options to terminate the leases within 30 days. In certain of the Company’s lease agreements, the rental payments are adjusted periodically to reflect actual charges incurred for capital area maintenance, utilities, inflation and/or changes in other indexes.
Lease liability is summarized below:
| September 30, |
| December 31, | |||
2021 | 2020 | |||||
Short term portion | $ | | $ | | ||
Long term portion |
| |
| | ||
Total lease liability | $ | | $ | | ||
Maturity analysis under these lease agreements are as follows:
| |||
| |||
2022 | $ | | |
2023 |
| | |
Total undiscounted cash flows |
| | |
Less: 10% Present value discount |
| ( | |
Lease liability | $ | |
Lease expense for the nine months ended September 30, 2021, and 2020, was comprised of the following:
Nine months ended | ||||||
September 30, | September 30, | |||||
| 2021 |
| 2020 | |||
Operating lease expense | $ | | $ | | ||
Short-term lease expense |
| |
| | ||
Total lease expense | $ | | $ | | ||
Operating lease expense is included in selling, general and administration expenses in the consolidated statement of operations.
For the nine months ended September 30, 2021, cash payments against lease liabilities totaled $
For the twelve months ended December 10, 2020, cash payments against lease liabilities totaled $
F-21
Weighted-average remaining lease term and discount rate for operating leases are as follows:
Weighted-average remaining lease term |
| ||
Weighted-average discount rate |
| | % |
NOTE 10 – ACCOUNTS PAYABLE AND ACCRUED EXPENSES
Accounts payable and accrued expenses consisted of the following as of September 30, 2021, and December 31, 2020:
| September 30, |
| December 31, | |||
2021 | 2020 | |||||
Accounts payable | $ | | $ | | ||
Interest payable |
| |
| | ||
Accrued liabilities |
| |
| | ||
Payroll liabilities |
| |
| | ||
Total accounts payable and accrued expenses | $ | | $ | | ||
NOTE 11 – NOTE PAYABLE
PPP loan round 1
On May 10, 2021, the Company received a notification from the Small Business Association for the full forgiveness of the PPP loan of $
PPP loan round 2
On April 26, 2021, the Company received the proceeds from a loan in the amount of $
In the event the loan, or any portion thereof, is forgiven pursuant to the PPP, the amount forgiven is applied to outstanding principal. While the Company intends to apply for the forgiveness of the loan, there is no assurance that the Company will obtain forgiveness of the loan in whole or in part. The Company intends to use the proceeds from the loan for qualifying expenses.
The application for these funds requires the Company to, in good faith, certify that the current economic uncertainty made the loan request necessary to support the ongoing operations of the Company. This certification further requires the Company to consider its current business activity and its ability to access other sources of liquidity sufficient to support ongoing operations in a manner that is not significantly detrimental to the business. The receipt of these funds, and the forgiveness of the loan attendant to these funds, is dependent on the Company having initially qualified for the loan and qualifying for the forgiveness of such loan based on its future adherence to the forgiveness criteria.
F-22
NOTE 12 – CONVERTIBLE DEBENTURES PAYABLE
Convertible debentures as of September 30, 2021: | ||||||||||||
Unpaid | Contractual | |||||||||||
Net Carrying Value | Principal | Interest Rates | Contractual | Warrants | ||||||||
Related party convertible debentures: | Current | Long Term | Balance | Cash | PIK | Maturity Date | issued | |||||
$ | (1) | $ | $ | $ | | |||||||
$ | (2) | - | | | | |||||||
$ | (2) | - | | | | |||||||
$ | (2) | - | | | | |||||||
$ | (2) | - | | | | |||||||
Total related party convertible debentures, net | $ | $ | $ | |||||||||
Convertible debentures: | ||||||||||||
$ | (3) | $ - | $ - | $ - | ||||||||
$ | (4) | - | - | - | ||||||||
$ | (2) | - | | | | |||||||
$ | (2) | - | | | | |||||||
Total convertible debentures, net | $ - | $ | $ | |||||||||
Convertible debentures as of December 31, 2020: | ||||||||||||
Unpaid | Contractual | |||||||||||
Net Carrying Value | Principal | Interest Rates | Contractual | Warrants | ||||||||
Related party convertible debentures: | Current | Long Term | Balance | Cash | PIK | Maturity Date | issued | |||||
$ | (1) | $ | $ | $ | | |||||||
$ | (2) | - | | | | |||||||
Total related party convertible debentures, net | $ | $ | $ | |||||||||
Convertible debentures: | ||||||||||||
$ | (3) | $ | $ | $ | ||||||||
$ | (4) | | - | | ||||||||
Total convertible debentures, net | $ | $ | $ | |||||||||
1) Unsecured convertible debentures (at $
F-23
purchase warrants, with each warrant exercisable at $
(2) On December 1, 2020, the Company offered, in a private placement, the aggregate offering amount of up to $
The Company treated the conversion feature as a derivative instrument. At the option of the Senior Secured Promissory Note holders, the notes are convertible at the earlier of a change of control event, a Qualified IPO, both of which are defined in the Promissory Note Agreement or the maturity date of December 1, 2022. If the conversion takes place at the maturity date, the note will be converted in whole or in parts (which cannot be less than 50% of the amount due under the note) into an amount of shares equal to the amount due divided by the average of the VWAP of common stock during each trading day during the thirty trading day period ending one trading day prior to the maturity date. If the conversion takes place at the change of control date, the note will be converted into an amount of shares equal to the amount due divided by the average of the VWAP of common stock during each trading day during the ten trading day period ending one trading day prior to the change of control effective date. In the event of a Qualified IPO, but subject to the closing of such Qualified IPO, the amount due shall convert in full on the closing date of such Qualified IPO into a number of shares equal to the amount due on such closing date divided by the applicable IPO conversion price, as defined in the Promissory Note Agreement.
The Senior Secured Promissory Debentures under the offering accrue cash interest at
| ● | $ |
| ● | $ |
| ● | $ |
| ● | $ |
| ● | $ |
| ● | $ |
F-24
(3) Convertible debentures (at $
(4) Secured convertible debenture (primary interest in all Company assets), interest at
The following table presents the interest expense related to the contractual interest coupon and the amortization of debt discounts on the convertible debentures:
Nine months ended September 30, | Twelve months ended December 31, | ||||
2021 | 2020 | ||||
Interest expense | $ | $ | |||
Interest accretion | |||||
Amortization of debt discounts | |||||
Total | $ | $ |
Maturity analysis under total convertible debentures, net are as follows:
For the years ended September 30, | |||
2022 | $ | | |
2023 |
| | |
2024 |
| | |
Convertible debentures payable, related and non related party |
| | |
Less: Debt discount on convertible debentures payable |
| ( | |
Total convertible debentures payable, related and non related party, net | $ | |
F-25
NOTE 13 – COMMITMENTS AND CONTINGENCIES
The Company may be involved in legal proceedings, claims and assessments arising in the ordinary course of business. Such matters are subject to many uncertainties, and outcomes are not predictable with assurance. There are
NOTE 14 – RELATED PARTY TRANSACTIONS
Related parties are natural persons or other entities that have the ability, directly or indirectly, to control another party or exercise significant influence over the party making financial and operating decisions. Related parties include other parties that are subject to common control or that are subject to common significant influences.
The Company borrowed funds for business operations from certain stockholders through convertible debenture agreements and has remaining balances, including accrued interest amounting to $
The Company received proceeds of $
A consulting firm controlled by a member of Company management provides services for the Company in the amount of $
NOTE 15 –STOCKHOLDERS’ EQUITY (DEFICIT)
Convertible Preferred Stock
In addition, as of such date, of the
As of September 30, 2021, there were (i)
Change in Number of Authorized and Outstanding Shares
On June 8, 2020, a
F-26
Common stock
Our authorized capital stock consists of
Nine months ended September 30, 2021
The Company issued an aggregate of
The Company issued
The Company converted a convertible note plus accrued interest in the amount of $
The Company issued
The Company issued
The Company issued
The Company issued
On September 30, 2021, the Company, entered into securities purchase agreements with accredited investors pursuant to which the Company sold, in a private offering,
Year ended December 31, 2020
During the year ended December 31, 2020, the Company issued an aggregate of
During the year ended December 31, 2020, the Company issued
During the year ended December 31, 2020, the Company issued
During the year ended December 31, 2020, the Company issued
During the year ended December 31, 2020, the Company issued
F-27
$
During the year ended December 31, 2020, the Company issued
During the year ended December 31, 2020, the Company issued
During the year ended December 31, 2020, the Company issued
During the year ended December 31, 2020, the Company had common stock subscribed with proceeds received of $
During the year ended December 31, 2020, the Company issued
NOTE 16 – STOCK OPTIONS AND WARRANTS
Options
Option valuation models require the input of highly subjective assumptions. The fair value of stock-based payment awards was estimated using the Black-Scholes option model with a volatility figure derived from using the Company’s historical stock prices. The Company accounts for the expected life of options based on the contractual life of options for non-employees. For employees, the Company accounts for the expected life of options in accordance with the “simplified” method, which is used for “plain-vanilla” options, as defined in the accounting standards codification. The risk-free interest rate was determined from the implied yields of U.S. Treasury zero-coupon bonds with a remaining life consistent with the expected term of the options.
The following table summarizes the stock option activity for the nine months ended September 30, 2021:
Weighted | Weighted Average | |||||||||
Average | Remaining | Aggregate | ||||||||
| Options |
| Exercise Price |
| Contractual Term |
| Intrinsic Value | |||
Outstanding at December 31, 2020 |
| | $ | |
| $ | | |||
Grants |
| | |
| | |||||
Exercised |
| — |
| — |
| — |
| — | ||
Expired |
| — |
| — |
| — |
| — | ||
Forfeited |
| ( |
| |
| — |
| — | ||
Outstanding at September 30, 2021 |
| | $ | |
| $ | | |||
Exercisable at September 30, 2021 |
| | $ | |
| $ | | |||
The aggregate intrinsic value in the preceding tables represents the total pretax intrinsic value, based on options with an exercise price less than the Company’s stock price of $
F-28
The following table presents information related to stock options on September 30, 2021:
Options outstanding | ||||||
Weighted | Options | |||||
average | exercisable | |||||
Exercise | Number of | remaining life | number of | |||
price |
| options |
| in years |
| options |
|
| |
|
| | |
|
| |
|
| | |
| | | ||||
| | | ||||
| | | ||||
| | | ||||
|
| | | |||
|
| |
|
| | |
| | — | ||||
| | | ||||
| | |||||
Stock-based compensation
The Company recognizes compensation expense for all stock options granted using the fair value-based method of accounting. During the nine months ended September 30, 2021, the Company issued
The Company calculated the fair value of options issued using the Black-Scholes option pricing model, with the following assumptions:
| September 30, 2021 |
| ||
Weighted average fair value of options granted | $ | |||
Expected life |
| |||
Risk-free interest rate |
| % | ||
Expected volatility |
| % | ||
Expected dividends yield |
| | % | |
Forfeiture rate |
| | % | |
The stock-based compensation expense related to option grants was $
F-29
Warrants
The following table summarizes the changes in warrants outstanding and the related prices for the shares of the Company’s common stock:
Warrants outstanding | Warrants exercisable | |||||||||||
Weighted | Weighted | |||||||||||
average | average | |||||||||||
remaining | Weighted | remaining | ||||||||||
contractual | average | contractual | ||||||||||
Number | life | exercise | Number | life | ||||||||
Exercise prices |
| outstanding |
| (years) | price |
| exercisable |
| (years) | |||
$ | $ | |||||||||||
The following table summarizes the warrant activity for the nine months ended September 30, 2021:
|
| Weighted | |||
average | |||||
exercise | |||||
Number of | price per | ||||
shares | share | ||||
Outstanding at December 31, 2020 | $ | ||||
Issued | |||||
Exercised | — | — | |||
Expired | — | — | |||
Outstanding at September 30, 2021 |
| | $ | | |
The Company records all warrants granted using the fair value-based method of accounting.
On September 30, 2021, the Company, entered into securities purchase agreements with accredited investors pursuant to which the Company sold, in a private offering,
During the nine months ended September 30, 2020, the Company issued
F-30
The Company calculated the fair value of warrants issued using the Black-Scholes option pricing model, with the following assumptions:
| September 30, 2021 |
| ||
Weighted average fair value of warrants granted | $ | |||
Expected life |
| |||
Risk-free interest rate |
| |||
Expected volatility |
| |||
Expected dividends yield |
| | % | |
Forfeiture rate |
| | % | |
NOTE 17 - INCOME TAX
On March 27, 2020, the CARES Act was enacted to provide economic relief to those impacted by the COVID-19 pandemic. In addition to the PPP loans, the CARES Act made various tax law changes including among other things (i) modifications to the federal net operating loss rules including permitting federal net operating losses incurred in 2018, 2019, and 2020 tax years to be carried back to the five preceding taxable years in order to generate a refund of previously paid income taxes, (ii) enhanced recoverability of AMT tax credit carryforwards, (iii) increased the limitation under Internal Revenue Code ("IRC") Section 163(j) for 2019 and 2020 to permit additional expensing of interest, and (iv) enacted a technical correction so that qualified improvement property can be immediately expensed under IRC Section 168(k).
On December 27, 2020, the Consolidated Appropriations Act of 2021 (“CAA”) was enacted and provided clarification on the tax deductibility of expenses funded with PPP loans as fully deductible for tax purposes. During the year ended September 30, 2021, the Company recorded income for financial reporting purposes related to the forgiveness of some of its PPP loans. The forgiveness of these PPP loans is not taxable.
The components of income (loss) before the provision (benefit) for income taxes are as follows:
September 30, 2021 |
| December 31, 2020 | ||||
Domestic Operations |
| $ | ( |
| $ | ( |
Foreign Operations |
|
| ( |
|
| - |
Total |
| $ | ( |
| $ | ( |
Income tax expense (benefit) consist of the following for the nine months ended September 30, 2021, and twelve months ended December 31, 2020, consist of the following:
Current: |
| September 30, 2021 |
| December 31, 2020 | |
Federal | $ | — | $ | | |
State | | ( | |||
Foreign | — | — | |||
Total Current provision (benefit) | | | |||
Deferred: | |||||
Federal | ( | — | |||
State | ( | — | |||
Foreign | ( | — | |||
Total Deferred provision (benefit) | ( | — | |||
Total provision (benefit) | $ | ( | $ | | |
F-31
The reconciliation between the U.S. statutory federal income tax rate and the Company’s effective rate for the nine months ended September 30, 2021, and twelve months ended December 31, 2020, is as follows:
| September 30, 2021 |
| December 31, 2020 | ||||
U.S. federal statutory rate | | % | | % | |||
State income taxes, net of federal benefit | | % | | % | |||
Goodwill impairment | ( | % | - | % | |||
Non-deductible items | ( | % | ( | % | |||
Change in valuation allowance | ( | % | ( | % | |||
Change in tax rates | ( | % | - | % | |||
US effects of foreign operations | ( | % | - | % | |||
Other | ( | % | ( | % | |||
Effective tax rate | | % | ( | % | |||
As of September 30, 2021, and December 31, 2020, the Company’s deferred tax assets (liabilities) consisted of the effects of temporary differences attributable to the following:
Deferred tax assets: |
| September 30, 2021 |
| December 31, 2020 | ||
Net Operating Losses | $ | | $ | | ||
Allowance for doubtful accounts | | | ||||
Stock-based compensation | | — | ||||
Fixed assets book/ tax basis difference | — | | ||||
Operating right of use assets | | | ||||
Accrued expenses | | | ||||
Amortization of debt discount | | | ||||
Research credit | — | | ||||
Intangible book/tax basis difference | | | ||||
Total deferred tax asset, net | | | ||||
Less: reserve for allowance | ( | ( | ||||
Total Deferred tax asset, net of valuation allowance | $ | | $ | — | ||
Deferred tax liabilities: | ||||||
Fixed assets book/ tax basis difference | ( | — | ||||
Derivative liability | ( | |||||
Total deferred tax liabilities | $ | ( | $ | — | ||
Total Deferred tax liability, net of valuation allowance | $ | - | $ | — | ||
ASC 740, “Income Taxes” requires that a valuation allowance is established when it is “more likely than not” that all, or a portion of, deferred tax assets will not be recognized. A review of all available positive and negative evidence needs to be considered, including the scheduled reversal of existing taxable temporary differences, projected future taxable income, and tax planning strategies. After consideration of all the information available, management believes that uncertainty exists with respect to the future realization of its deferred tax assets and has, therefore, established a full valuation allowance as of September 30, 2021, and December 31, 2020.
As of September 30, 2021, the Company has federal net operating loss carryforwards of $
F-32
testing period, which is generally the three-year period preceding any potential ownership change. The Company has not completed an analysis to determine whether any such limitations have been triggered as of September 30, 2020.
As of September 30, 2021, the Company has state net operating loss carryforwards of $
The Company files income tax returns in the U.S. federal and various state jurisdictions. As of September 30, 2021, the federal and state tax returns for the years from 2016 through 2020 remain open to examination by the Internal Revenue Service and various state authorities. As of September 30, 2021, and December 31, 2020, the Company has evaluated and concluded that there were no material uncertain tax positions requiring recognition in the Company’s financial statements. The Company’s policy is to classify assessments, if any, for tax-related interest as income tax expenses.
For the nine months ended September 30, 2021, and twelve months ended December 31, 2020. The Company does not expect its unrecognized tax benefit position to change during the next twelve months.
NOTE 18 – SUBSEQUENT EVENTS
The Company has evaluated all subsequent events through the date of filing, January 21, 2022, of this Transition Report on Form 10-K with the SEC, to ensure that this filing includes appropriate disclosure of events both recognized in the financial statements as of September 30, 2021, and events which occurred after September 30, 2021, but which were not recognized in the financial statements. The Company has determined that there were no subsequent events which required recognition, adjustment to or disclosure in the financial statements.
F-33